
- Title
-
Sensory-Motor Perturbations in Larval Zebrafish (Danio rerio) Induced by Exposure to Low Levels of Neuroactive Micropollutants during Development
- Authors
- Henry, J., Bai, Y., Kreuder, F., Saaristo, M., Kaslin, J., Wlodkowic, D.
- Source
- Full text @ Int. J. Mol. Sci.
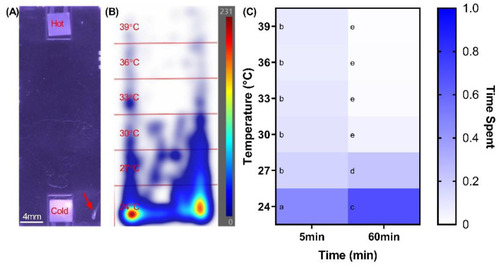
Responses of larval zebrafish to a thermal gradient of 24–39 °C (A) Photograph depicting the miniaturized electrothermal array chamber with a zebrafish at 5 dpf, (B) An occupancy heatmap of the zebrafish activity highlighting a very strong preference for the 24 °C zone after 60 min of exposure to the thermal gradient (C) The thermal preference of zebrafish larvae after 5- and 60-min exposure to the thermal gradient, respectively. Means sharing a letter are not significantly different (p > 0.05). |
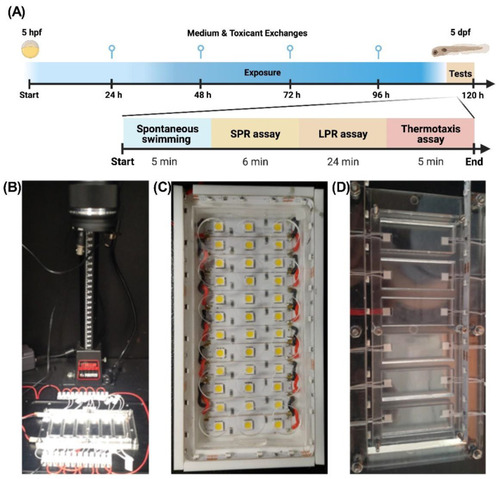
A high throughput multidimensional behavioral test battery (A) workflow depicting protocol of the multidimensional behavioral test battery. Zebrafish were exposed to toxicants in the embryonic stage (5 hpf) through to free swimming larval stage (5 dpf), with media exchanges occurring daily. The larval zebrafish then underwent the automated battery comprised of the spontaneous swimming (SS), simulated predator response (SPR), larval photomotor response (LPR) assays as well as a new thermotaxis (TX) biotests; (B) Overview of the purpose build analytical system used in the multidimensional behavioral test battery; (C) A photic module used for SPR and LPR stimuli biotests, (D) An electrothermal module used for thermotactic biotests. |
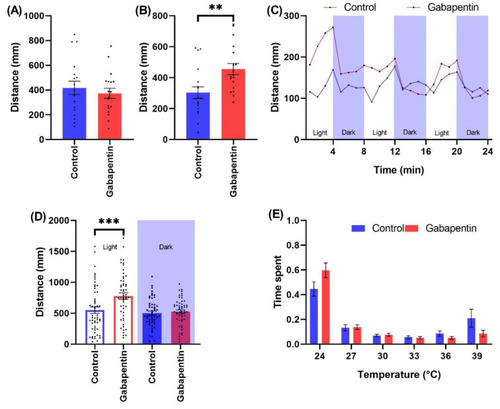
The effects of gabapentin (400 ng/L) exposure on wild type zebrafish behavioral indices during the testing battery. The behavioral assays included (A) Spontaneous swimming, (B) SPR, (C) Time resolved LPR, (D) LPR cumulated comparison, and (E) Thermotaxis assay. Note ** 0.01 > p > 0.001 and *** p < 0.001. |
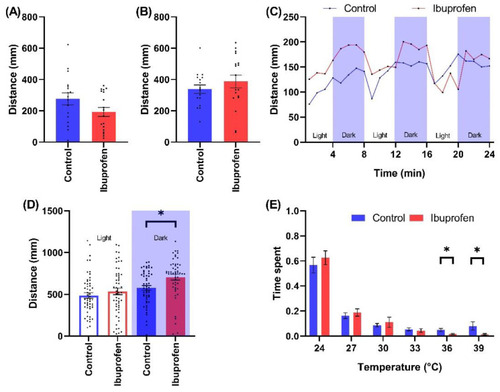
The effects of ibuprofen (9800 ng/L) on wild type zebrafish behaviors throughout the testing battery. The behavioral battery included (A) Spontaneous swimming, (B) SPR, (C) Time resolved LPR, (D) LPR cumulated comparison, and (E) Thermotaxis assay. Note * 0.05 > p > 0.01. |
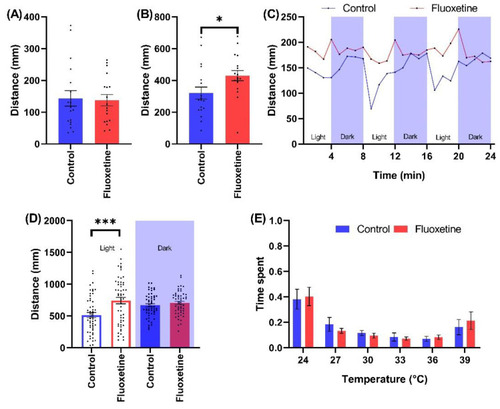
The effects of fluoxetine (300 ng/L) exposure on wild type zebrafish behavioral indices during the testing battery in (A) Spontaneous swimming, (B) SPR, (C) Time resolved LPR, (D) LPR cumulated comparison, and (E) Thermotaxis assays. Note * 0.05 > p > 0.01 and *** p < 0.001. |