
- Title
-
LGP2 is essential for zebrafish survival through dual regulation of IFN antiviral response
- Authors
- Gong, X.Y., Zhang, Q.M., Zhao, X., Li, Y.L., Qu, Z.L., Li, Z., Dan, C., Gui, J.F., Zhang, Y.B.
- Source
- Full text @ iScience

LGP2 deficiency impairs zebrafish survival against SVCV infection (A and B) RT-PCR detection of lgp2 (or lgp2-talen) mRNA in the indicated tissues from lgp2+/+ and lgp2lof/lof zebrafish adults (60 dpf) in healthy state (A) or following i.p. injection with SVCV (108 TCID50/mL) (B). (C) Western blot analysis of LGP2 protein in the gill from lgp2+/+ and lgp2lof/lof zebrafish (120 dpf) by with LGP2 antibody. ∗ indicated the LGP2 protein band. The bands below ∗ were nonspecific proteins. (D) Representative imaging of lgp2+/+ and lgp2lof/lof zebrafish larvae (6 dpf, n = 50) immersed with SVCV (2×10⁶ TCID50/mL) for 2 d. Red arrows indicated the dead larvae. (E and F) Mortality analysis of lgp2lof/lof larvae (E) and adults (F) together with WT zebrafish following SVCV infection. (E) lgp2+/+ and lgp2lof/lof zebrafish larvae (6 dpf, n = 100) were immersed with SVCV (5×10⁵ TCID50/mL). (F) lgp2+/+ and lgp2lof/lof zebrafish adults (60 dpf, n = 50) were injected i.p. with SVCV (108 TCID50/mL), at 20 μL per fish. (G and H) LGP2 deficiency exacerbated SVCV replication in zebrafish larvae (G) and adults (H). lgp2lof/lof larvae (6 dpf) and adults (60 dpf) together with WT zebrafish were infected with SVCV as in (E) and (F), respectively. The expression of five SVCV genes, including nucleoprotein (N), phosphoprotein (P), matrix protein (M), glycoprotein (G), and RNA polymerase (L) was detected by RT-PCR. Data were shown as mean ± SD (N = 3). P values were calculated using Student’s t test. ∗p < 0.05, ∗∗p < 0.01. See also Figure S1, and Table S1. EXPRESSION / LABELING:
|
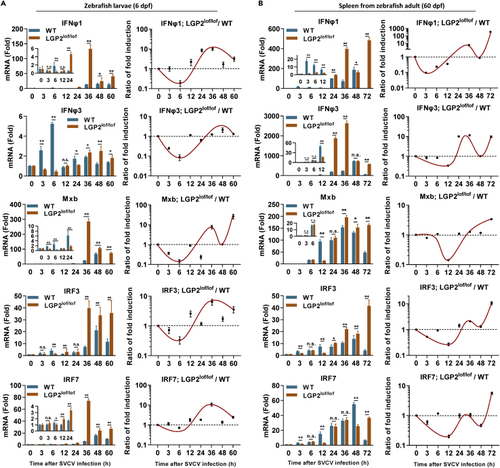
LGP2 promotes IFN response at the early phase of SVCV infection but attenuates at the late phase (A) mRNA expression comparison of two ifn genes and three ISGs between lgp2+/+ and lgp2lof/lof zebrafish larvae following SVCV infection. Left panels: lgp2+/+ and lgp2lof/lof zebrafish larvae (6 dpf) were immersed with SVCV (5×10⁵ TCID50/mL) for the indicated time points, followed by RT-PCR detection of the mRNA levels of ifnφ1, ifnφ3, mxb, irf3, and irf7. The expression values were expressed as fold induction relative to that in mock-infected larvae following normalization to β-actin. Right panels: the induction ratio of each gene between lgp2lof/lof and WT larvae was calculated based on the fold induction at the same time point, followed by normalization to the ratio at 0 h postinfection, which was set to 1, indicating no change. (B) mRNA expression comparison of two ifn genes and four ISGs in spleens between lgp2+/+ and lgp2lof/lof zebrafish adults following SVCV infection. Left panels: lgp2+/+ and lgp2lof/lof zebrafish adults (60 dpf) were injected i.p. with SVCV (108 TCID50/mL) for the indicated time points, followed by RT-PCR detection. Right panels: the fold induction ratios of each gene in spleen between lgp2+/+ and lgp2lof/lof zebrafish adults. Data were shown as mean ± SD (N = 3). P values were calculated using Student’s t test. ∗p < 0.05, ∗∗p < 0.01; n.s., not significant. See also Figure S2, and Table S1. EXPRESSION / LABELING:
PHENOTYPE:
|
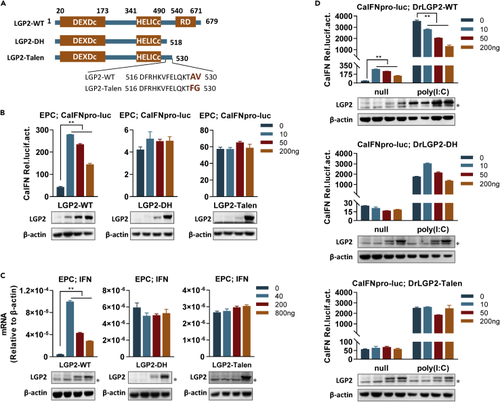
LGP2-talen is not functional in fish IFN response (A) Schematic of wild-type LGP2 (LGP2-WT), LGP2-talen, and LGP2-DH. (B) Fish IFN promoter is activated by zebrafish LGP2 but not by LGP2-DH and LGP2-talen. EPC cells seeded in 24-well plates were cotransfected with CaIFNpro-luc (200 ng), Renilla vector (pRL-TK, 20 ng), and LGP2-WT/LGP2-DH/LGP2-talen at increasing doses (0, 10, 50, 200 ng) for 48 h, followed by luciferase assays. (C) Cellular ifn gene was not induced by LGP2-talen. EPC cells seeded in 6-well plates were transfected with LGP2-WT, LGP2-DH, or LGP2-talen at increasing amounts (0, 40, 200, 800 ng) for 48 h, followed by RT-PCR. (D) LGP2-talen failed to inhibit poly(I:C)-triggered IFN response. EPC cells seeded in 24-well plates were transfected for 24 h with 200 ng of CaIFNpro-luc and increasing amounts (0, 10, 50, 200 ng) of LGP2-WT or LGP2-talen or LGP2-DH, followed by transfection again with poly(I:C) (1 μg/mL). Another 24 h later, luciferase assays were performed. Western blots in (B), (C), and (D) showed the ectopically expressed LGP2 in a dose-dependent manner by zebrafish LGP2 antibody. ∗Nonspecific band. Data were shown as mean ± SD (N = 3). P values were calculated using Student’s t test. ∗∗p < 0.01. See also S3 and Table S1. |
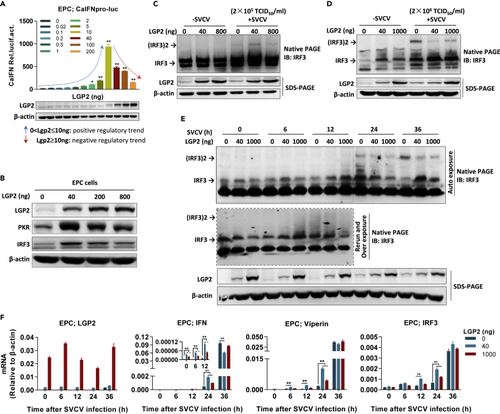
LGP2 functions as a dual regulation of itself- and virus-induced IFN response (A and B) LGP2 played antithetic role in itself-induced fish IFN promoter activation (A) and upregulation of IFN-inducible proteins (B). EPC cells seeded in 24-well plates (A) or 6-well plates (B) were transfected with LGP2 at the indicated doses for 48 h, followed by luciferase assays (A) or by western blot detection of PKR, IRF3, and LGP2 with corresponding antibodies (B). Western blot in (A) showed the ectopically expressed LGP2 in a dose-dependent manner by zebrafish LGP2 antibody. (C and D) IRF3 dimerization was analyzed in SVCV-infected CAB cells in the absence or presence of LGP2. CAB cells seeded in 6-well plates overnight were transfected with LGP2 at the indicated doses for 24 h, followed by infection with SVCV at a relatively low titer (2×10⁵ TCID50/mL) (C) or at a relatively high titer (2×10⁶ TCID50/mL) (D) for another 24 h. The transfected cells were collected to detect IRF3 dimerization by native PAGE with anti-IRF3 Ab. (E and F) LGP2 exerted an early synergizing and a late inhibitory regulation on ifn, viperin, and irf3 mRNA expression along SVCV infection. EPC cells seeded in 6-well plates overnight were transfected with the indicated doses of LGP2 for 24 h, followed by infection with SVCV (2×10⁵ TCID50/mL). At the indicated time postinfection, cells were collected to detect IRF3 dimerization by native PAGE with anti-IRF3 Ab and LGP2 expression by SDS-PAGE with anti-LGP2 Ab (E) or to detect the expression of lgp2, ifn, viperin, and irf3 expression by RT-qPCR (F). Data were shown as mean ± SD (N = 3). P values were calculated using Student’s t test. ∗p < 0.05, ∗∗p < 0.01. |

Function switch of LGP2 is related to IFN production but not to IFN signaling (A) Luciferase assay analyses of LGP2-triggered fish IFN promoter activation in the absence or presence of the indicated dominant negative mutants of RLR signaling molecules. EPC cells seeded in 24-well plates were cotransfected with CaIFNpro-luc, each of the indicated dominant negative plasmids (200 ng each), together with LGP2 at increasing doses for 48 h. (B) LGP2-directed mRNA expression of cellular genes was suppressed by functional blockade of RLR signaling. EPC cells seeded overnight in 6-well plates were transfected with each of the indicated dominant negative plasmids (800 ng), together with LGP2 at increasing amounts for 48 h, followed by RT-PCR detection of ifn, mx, viperin, irf3, and irf7 transcripts. (C) Antithetic effects of LGP2 on poly(I:C)-triggered fish IFN promoter activation in the absence or presence of IRF3-DN or IRF7-DN by luciferase assays. EPC cells seeded in 24-well plates were transfected with CaIFNpro-luc and LGP2, together with IRF3-DN or IRF7-DN (200 ng each) for 24 h, followed by transfection again with poly(I:C) at increasing concentrations (from 0 to 160 ng/mL) for another 24 h. (D–F) Function blockade of IRF9 did not impair LGP2-triggered negative regulatory trend in the presence of LGP2 self (D), poly(I:C) (E), and MDA5 (F). EPC cells seeded in 24-well plates were transfected as in (A) with the indicated plasmids for 24 h (D and F) followed by luciferase assays or transfected again with poly(I:C) (1 μg/mL) for another 24 h (E) followed by luciferase assays. IRF9-ΔC and MDA5 was transfected at 200 ng. Western blot in (A–F) showed the ectopically expressed LGP2 in a dose-dependent manner by anti-LGP2 Ab, and it is noted that the endogenous LGP2 was also induced by poly(I:C) in (E). ∗Nonspecific band. Data were shown as mean ± SD (N = 3). P values were calculated using Student’s t test. ∗∗p < 0.01. See also Figure S4 and Table S1. |
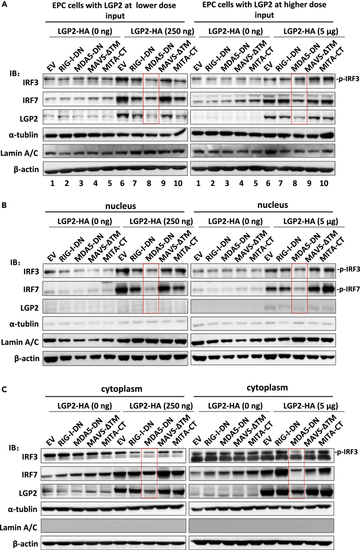
LGP2 positively regulates fish IFN response dependently of MDA5 (A–C) LGP2-directed nuclear accumulation of IRF3 and IRF7 was significantly inhibited by functional blockade of MDA5 signaling. EPC cells seeded in 10-cm dishes were cotransfected with LGP2-HA at a low dose of 250 ng (left panels) or a high dose of 5 μg (right panels), together with the indicated dominant negative mutants (5 μg each). Forty-eight hours later, the transfected cells were harvested for fractionation of the nucleus and cytoplasm. IRF3, IRF7, and LGP2 proteins were detected by western blot analysis of whole-cell lysates as input (A), nuclear extracts (B), and cytoplasmic extracts (C), with antibodies specific to fish IRF3, IRF7, and LGP2, respectively. The red boxes highlighted the essential effects of MDA5-DN on LGP2-triggered signaling. |
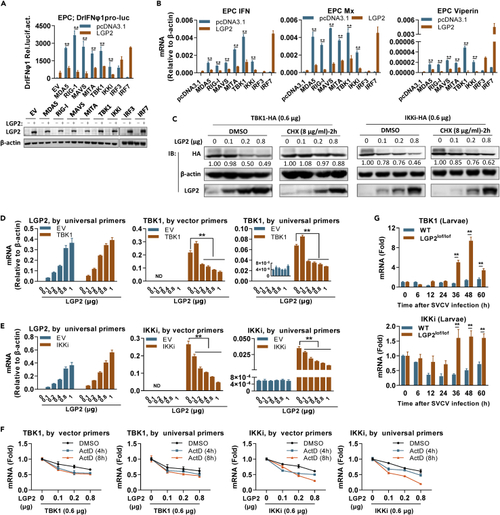
LGP2 negatively regulates IFN response by attenuating tbk1 and ikki mRNA levels (A and B) LGP2 inhibited fish IFN promoter activation (A) and ifn expression (B) induced by RLR signaling molecules upstream of IRF3/7. EPC cells seeded in 24-well plates were transfected with DrIFNφ1pro-luc, LGP2, and each of the indicated RLR signaling molecules (200 ng each) for 48 h, followed by luciferase assays (A) or by RT-PCR detection of cellular ifn, mx, and viperin mRNA (B). Western blots in (A) showed the expression of LGP2 protein in (A and B) by western blots using anti-LGP2 Ab. (C) LGP2-mediated protein reduction of TBK1 and IKKi was abolished by CHX. EPC cells seeded in 6-well plates overnight were transfected for 24 h with TBK1 or IKKi (0.6 μg each), together with LGP2 at increasing doses, followed by addition of CHX (8 μg/mL) or DMSO as control. Another 2 h later, cells were collected for western blotting analysis of TBK1 and IKKi by anti-HA Ab and LGP2 by anti-LGP2 Ab. The numbers show the densitometric quantification of TBK1 or IKKi protein expression normalized to β-actin. (D and E) LGP2 attenuated mRNA levels of the transfected TBK1 (D) and IKKi (E). CO cells seeded in 6-well plates were transfected with LGP2 at increasing doses (0, 0.1, 0.2, 0.4, 0.8, 1 μg), together with TBK1 (300 ng, D) or IKKi (300 ng, E) for 48 h, followed by RT-PCR detection of lgp2, tbk1, and ikki mRNA, respectively. Universal primers were designed against the ORF sequences of tbk1 and ikki for detection of mRNA from cellular genes and the transfected plasmids together, and vector primers only detected mRNA from the transfected plasmids because a forward primer was designed against vector sequences. (F) LGP2-mediated reduction of tbk1 and ikki mRNA levels was not impaired by ActD. EPC cells seeded in 6-well plates overnight were transfected for 24 h as in (C), followed by addition of ActD (1 μg/mL) or DMSO as control. At 48 h after ActD addition, tbk1 and ikki transcripts were detected by universal primers and vector primers. (G) The transcript levels of tbk1 and ikki were enhanced in lgp2lof/lof zebrafish larvae during the later period of SVCV infection, in contrast to a nearly constant transcript level in WT larvae. The samples were the same as in Figure 2A. Data were shown as mean ± SD (N = 3). P values were calculated using Student’s t test. ∗∗p < 0.01. See also Figure S5 and Table S1. |

LGP2 is essential for IFN response at the early stage of viral infection (A) Stimulatory effects of zebrafish LGP2, MDA5, and RIG-I on fish IFN promoter activation by luciferase activity assays. CO cells seeded in 24-well plates were transfected with LGP2, MDA5, and RIG-I at increasing amounts (0, 5, 10, 200 ng) for 48 h. Western blots in (A and B) showed the expression of LGP2 in the transfected cells using anti-LGP2 Ab. (B) mRNA expression comparison of cellular ifn gene by LGP2, MDA5, and RIG-I. EPC cells seeded in 6-well plates were transfected with LGP2, MDA5, and RIG-I at increasing amounts (0, 20, 40, 800 ng) for 48 h, followed by RT-PCR detection of lgp2 and ifn mRNA. (C) RT-PCR detection of rig-I and mda5 mRNA in lgp2+/+ and lgp2lof/lof zebrafish larvae (6 dpf) or in spleen of lgp2+/+ and lgp2lof/lof zebrafish adults (60 dpf) following SVCV infection. Data were shown as mean ± SD (N = 3). P values were calculated using Student’s t test. ∗∗p < 0.01. EXPRESSION / LABELING:
|