
- Title
-
Cell landscape of larval and adult Xenopus laevis at single-cell resolution
- Authors
- Liao, Y., Ma, L., Guo, Q., E, W., Fang, X., Yang, L., Ruan, F., Wang, J., Zhang, P., Sun, Z., Chen, H., Lin, Z., Wang, X., Wang, X., Sun, H., Fang, X., Zhou, Y., Chen, M., Shen, W., Guo, G., Han, X.
- Source
- Full text @ Nat. Commun.
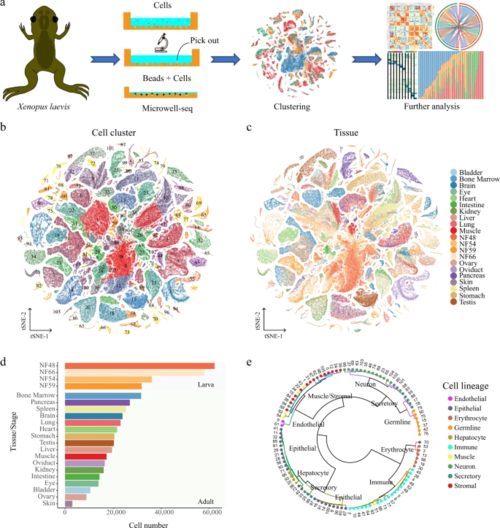
a A schematic of the basic workflow for the Xenopus cell landscape using the Microwell-seq platform. b t-SNE analysis of 501, 358 single cells collected from larval and adult tissues. The 106 cell-type clusters are labeled in different colors. Cell cluster markers are listed in Supplementary Dataset 1. c t-SNE analysis of 501, 358 single cells collected from larval and adult tissues. Tissues/stages are labeled in different colors. d Cell number of each tissue/stage is detected at the XCL. Tissues/stages are labeled in different colors. e The 106 cell-type clusters are re-clustered into ten cell lineages and circles showing the relationships among the 106 cell types. Cell lineages are labeled in different colors. |
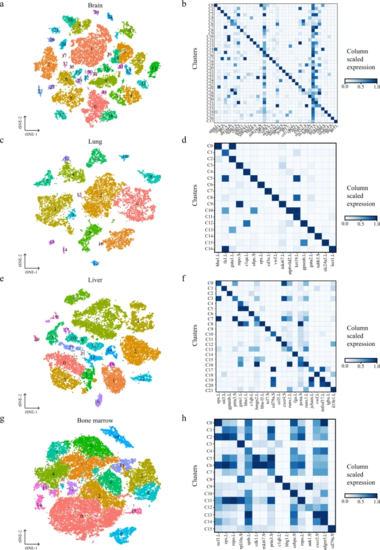
t-SNE map of Xenopus brain (a), lung (c), liver (e), and bone marrow (g) single-cell data. Cells are colored by cell-type cluster; Heatmap showing representative gene expression in each cluster of Xenopus brain (b), lung (d), liver (f), and bone marrow (h). The color encodes the average expression level. |

a Circle plot showing the similarity of cell lineages in Xenopus laevis, zebrafish (left), mice (middle), and humans (right). Pairs of cell types with mapping scores greater than 0.1 are connected by lines. Cell lineages are labeled in different colors. b Heatmap showing the specific scores of TFs in Xenopus for each cell type. Each row represents one TF, and each column represents one cell lineage. Cell lineages are labeled in different colors. The representative TFs in each cell lineage are presented in the right panel. c Sankey plot showing common lineage-specific transcription factors in endothelial for four vertebrates (humans, mice, Xenopus, and zebrafish). The representative TFs in Xenopus laevis are labeled by red. Different TFs in each species are marked in different color boxes. Homologous TFs between species obtained from SAMap are connected by lines. |

a Expression trajectory of genes regulated by T3 during metamorphosis. b, t-SNE analysis of 188, 020 single cells collected from larval Xenopus. 57 cell-type clusters are labeled in different colors. Cell cluster markers are listed in Supplementary Dataset 1. c t-SNE analysis of 188, 020 single cells collected from larval Xenopus. Stages are labeled in different colors. d Stage proportion in different cell clusters. Stages are labeled in different colors. e dTFs are listed in different stages for cell lineages. Each row represents one stage and each column represents one cell type. The representative TFs for each cell types are labeled by red. |
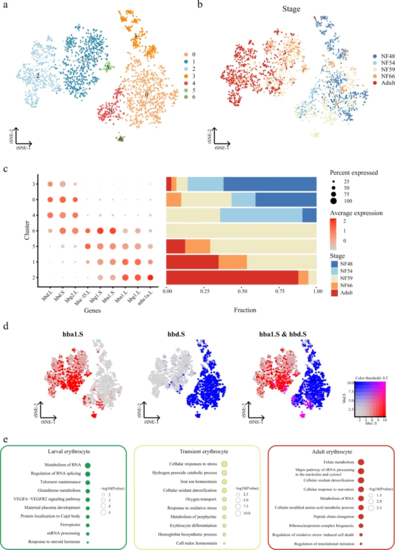
a t-SNE analysis of erythrocytes collected from larval and adult Xenopus. Different clusters are labeled in different colors. Erythrocytes from adults were sampled to the same order of magnitude as in larva. Cell cluster markers are listed in Supplementary Dataset 3. b t-SNE analysis of erythrocytes collected from larval and adult Xenopus. Different stages are labeled in different colors. c Representative gene expression in each cluster of erythrocytes and cell proportions in different stages are shown. Stages are labeled in different colors. The size of the dot encodes the percentage of cells within a cell type, and the color encodes the average expression level. d Feature plot in the t-SNE map of erythrocytes collected from larval and adult Xenopus. Cells are colored according to the expression of the indicated marker genes hba1.S (red), hbd.S (blue), and co-expression hba1.S and hbd.S (pink). e Representative GO terms enriched in each module for three cell types. Different cell clusters are labeled in different colors. P value was calculated by the hypergeometric distribution, a statistical test is one-sided, adjustments P values were made after P value is corrected by Benjamin–Hochberg multiple test. |
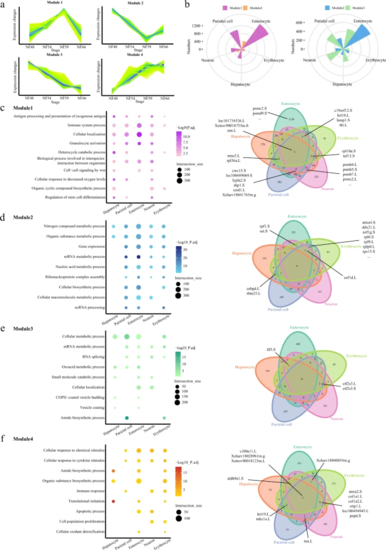
a Schematic diagram of the four modules. b Rose diagrams showing the distribution of DEGs in each cell type. Different modules are labeled in different colors. c–f Representative GO terms enriched in module 1 (c), 2 (d), 3 (e), and 4 (f) for five cell types, respectively (left). GO terms enriched in different modules are labeled in different colors. Venn diagrams showing the numbers of shared genes in each module (right). The bold lines indicate the representative genes shared in at least three cell types. P value was calculated by the hypergeometric distribution, statistical test is one-sided, adjustments P values were made after P value is corrected by Benjamin–Hochberg multiple tests. |