
- Title
-
Dietary Perfluorohexanoic Acid (PFHxA) Exposures in Juvenile Zebrafish Produce Subtle Behavioral Effects across Generations
- Authors
- Rericha, Y., Truong, L., Leong, C., Cao, D., Field, J.A., Tanguay, R.L.
- Source
- Full text @ Toxics

Figure 1. Experimental Overview. F0 zebrafish were dietarily exposed from 17 to 59 days post fertilization (dpf) to diets contaminated with (left to right) 0 (control), 1, 10, or 100 ng/g PFHxA. Immediately following dietary exposure, measurements of morphometrics and body burden were performed. Following a subsequent depuration period, fecundity and adult behavior were assessed after 90 dpf. One spawning event was used to generate the F1 generation, which underwent assessments of developmental toxicity, larval and juvenile behavior, fecundity, and adult behavior. The same experimental protocols were used to interrogate transgenerational effects in the F2 generation.
|

Figure 2. Morphometrics. At 60 dpf, following dietary exposure, zebrafish body length (A), weight (B), and Fulton’s Condition Factor K (C) were measured (n = 36), as well as average weight (n = 4) of 8 pooled brains (D) or 8 pooled livers (E). No significant differences between exposure groups were observed.
|

Figure 3. Fecundity Assessments. 4 groups of 3 male and 2 female zebrafish were spawned for 5–6 consecutive spawning events per generation (top: F0, middle: F1, bottom: F2). The average embryo counts are plotted on the left, including necrotic (black), unfertilized (dark grey), and fertilized (light grey) embryos for each exposure group (0, 1, 10, or 100 ng/g PFHxA added to the F0 diet). The tables on the right indicate the evaluated number of spawns (N), mean counts, and standard deviation.
|
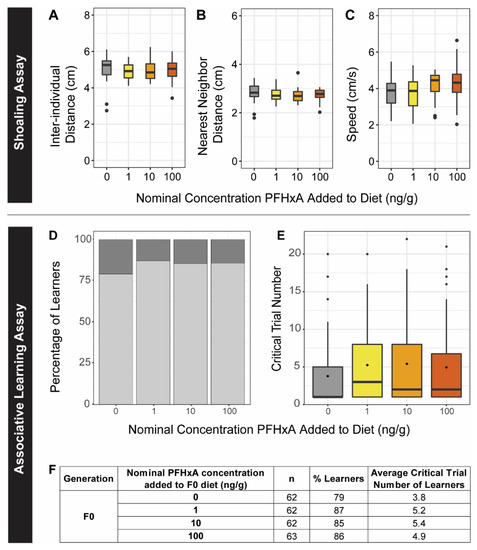
Figure 4. Social Perception and Associative Learning Behavior for F0. F0 zebrafish were challenged with adult behavior shoaling (A–C) and associative learning assays (D–F). Exposure groups are indicated on the x-axes and by color (left to right, grey: 0 ng/g, yellow: 1 ng/g, orange: 10 ng/g, and red: 100 ng/g PFHxA added to the diet). Dietary exposure did not alter social perception (n = 64), as measured by inter-individual distance (A), nearest neighbor distance (B), or speed (C). Learning was also not impaired by PFHxA exposure, as measured by the percentage of learners (D) and critical trial number (E). Sample size, percent learners, and mean critical trial are presented in the table (F).
|

Figure 5. Anxiety Behaviors for F0. F0 zebrafish were challenged with adult behavior free swim (A), predator response (B), and schooling response assays (C). Exposure groups are indicated on the x-axes and by color (left to right, grey: 0 ng/g, yellow: 1 ng/g, orange: 10 ng/g, and red: 100 ng/g PFHxA added to the diet). PFHxA juvenile dietary exposure did not affect the total distance traveled in the free swim assay (n = 66–68). The predator and schooling response plots show the percent time (cumulative duration) spent in the near zone (i.e., closest to the video display). For both predator and schooling response (n = 65–68), time spent was significantly decreased for all groups after video display (Video) compared to before (Acclimation). Significant differences between exposure groups within the Acclimation and Video periods are indicated on the plots (* p < 0.05; ** p < 0.005).
|
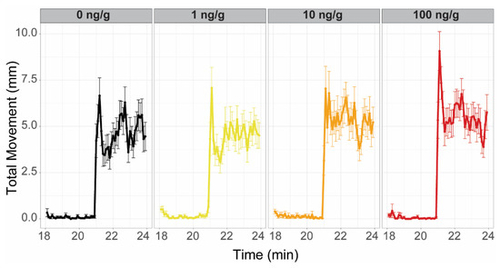
Figure 6. F1 Larval Photomotor Response. Plots represent one of the evaluated F1 zebrafish cohorts and are representative of both evaluated cohorts (120 hours post fertilization). Exposure groups are indicated on the top of each panel and by color (left to right, grey: 0 ng/g, yellow: 1 ng/g, orange: 10 ng/g, and red: 100 ng/g PFHxA added to the F0 diet). In each panel, the first 3 min were the final light period (lower total movement), while the last 3 min were the final dark period. The 10 ng/g group exhibited significant hyperactivity in the dark period relative to controls (n = 48).
|

Figure 7. F1 Juvenile Behavior Assays. F1 zebrafish exposure groups are indicated on the x-axes and by color (left to right, grey: 0 ng/g, yellow: 1 ng/g, orange: 10 ng/g, and red: 100 ng/g PFHxA added to the F0 diet). During the light/dark preference assay at 10 dpf, no significant differences in total distance swam (A) or percent time spent (B) in the light or dark (striped boxes) assay zones were observed between exposure groups. In the mirror response assay at 28 dpf, no differences in distance traveled (C) or percent time spent (D) in the mirror zone during the light or dark periods (striped boxes) were noted. During the juvenile shoaling assay at 28 dpf, the average inter-individual distance (IID) of the 100 ng/g group was significantly lower than that of controls (E). Average nearest neighbor distance (NND) of the 1 and 100 ng/g groups were less than controls (F). Speed of the 10 ng/g group was significantly lower than that of controls (G). Significant differences between exposure groups are indicated on the plots (* p < 0.05; ** p < 0.005).
|