
- Title
-
Optic nerve injury-induced regeneration in the adult zebrafish is accompanied by spatiotemporal changes in mitochondrial dynamics
- Authors
- Beckers, A., Masin, L., Van Dyck, A., Bergmans, S., Vanhunsel, S., Zhang, A., Verreet, T., Poulain, F.E., Farrow, K., Moons, L.
- Source
- Full text @ Neural Regen Res
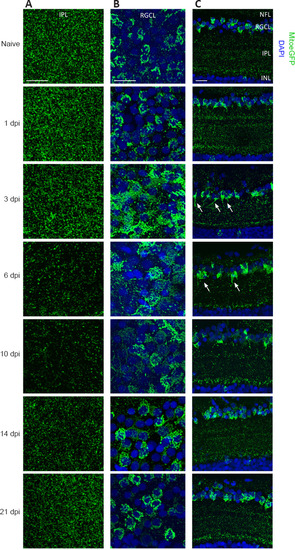
Mitochondrial distribution visualized on whole mounts and cryosections of MitoeGFP+ retinas, harvested at baseline (naive) or after ONC injury. (A) Morphological observations in the IPL of retinal whole mounts show that the number of GFP+ mitochondria was decreased from 3 dpi onwards, which results in minimal mitochondrial levels from 6–10 dpi. Baseline levels were reached again by 21 dpi. (B) In the RGCL, a rise in mitochondrial abundance and a more scattered pattern were detected at 3 dpi. Both the increase and the spread-out distribution of mitochondria were resolved over the following days, resulting in a similar distribution and number 3 weeks post-ONC. (C) Using retinal cryosections, less mitochondria were observed in the IPL between 3–6 dpi, compared to baseline. In this time window, mitochondria cluster in lines within the inner IPL close to the RGCL (white arrows). At 10 dpi mitochondrial numbers start to increase, first specifically in a region adjacent to the INL; they were restored throughout the complete plexiform layer at later time points. Two to three weeks post-injury, the mitochondrial distribution was roughly similar to that in the naive condition. In the RGCL, more mitochondria were observed at 3 dpi. No obvious changes in mitochondrial distribution were detected in the NFL. Scale bars: 25 µm, representative images of n = 4 per condition. DAPI: 4′,6-Diamidino-2-phenylindole; dpi: days post-injury; GFP: green fluorescent protein; INL: inner nuclear layer; IPL: inner plexiform layer; MitoeGFP: mitochondrial targeting sequence fused to enhanced GFP; NFL: nerve fiber layer; ONC: optic nerve crush; RGCL: retinal ganglion cell layer. |
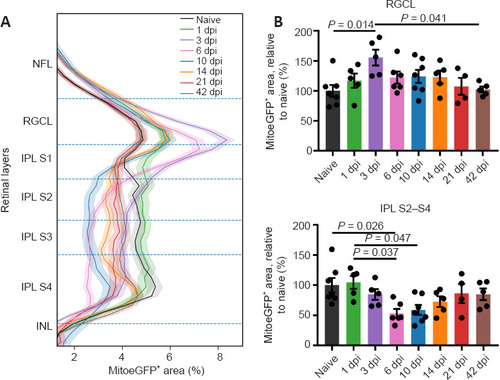
Inner retinal MitoeGFP+ area profile, combined with bar graphs representing the results per retinal layer, at baseline (naive) or after ONC injury. (A) Profiles of the MitoeGFP+ area covering all inner retinal layers at different time points after injury. (B) In the IPL sublaminae S2–S4, the mitochondrial area is decreased after injury, and baseline mitochondrial levels are re-reached from three weeks onwards. A transient rise in mitochondrial mass at 3 dpi was visible in the RGCL. Data represent mean ± 95% confidence intervals, n = 4–76 per condition, one-way analysis of variance followed by Tukey’s post hoc test. Dpi: Days post-injury; GFP: green fluorescent protein; INL: inner nuclear layer; IPL: inner plexiform layer; MitoeGFP: mitochondrial targeting sequence fused to enhanced GFP; NFL: nerve fiber layer; ONC: optic nerve crush; RGCL: retinal ganglion cell layer. |
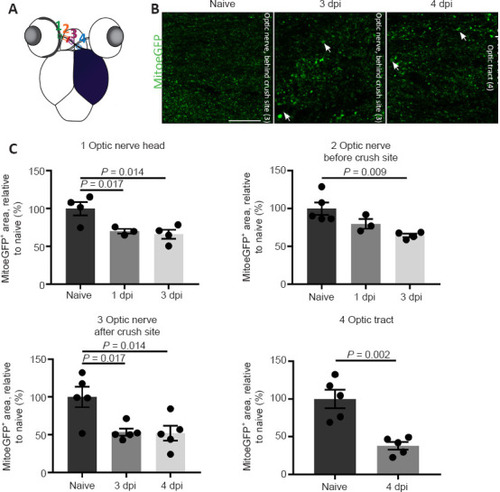
Mitochondrial distribution visualized and quantified on cryosections of MitoeGFP+ visual systems, harvested at baseline (naive) or after ONC injury. (A) Schematic overview of the four areas used to quantify mitochondrial density in the optic nerve/tract: 1) optic nerve head; 2) optic nerve before crush site; 3) optic nerve after crush site; 4) optic tract. (B) Compared to control fish, the number of mitochondria was reduced in all regions of the injured nerve, here visualized on representative parts of the optic nerve and tract at 3 and 4 dpi, respectively. Strikingly, mitochondria located after the crush site in the optic nerve/tract were often increased in size (white arrows). (C) Quantification of the MitoeGFP+ area confirmed a reduced mitochondrial density early after ONC, in the optic nerve head, optic nerve, and optic tract. Data represent the mean ± SEM, n = 3–5 fish per condition, one-way analysis of variance followed by Tukey’s post hoc test. Scale bar: 25 µm. Dpi: Days post-injury; GFP: green fluorescent protein; MitoeGFP: mitochondrial targeting sequence fused to enhanced GFP; ONC: optic nerve crush. |

Mitochondrial distribution visualized on vibratome sections of MitoeGFP+ optic tecti, harvested at baseline (naive) or after ONC injury. (A) MitoeGFP+ mitochondria (green) can be observed in the RGC axon terminals (red), which were visualized using a membrane tag and located in the SO and SFGS of the zebrafish optic tectum. Nuclei were counterstained using DAPI (blue). The right panel depicts a schematic overview of a central coronal section of the optic tectum, with the magnified area indicated with a box. (B) Detailed images show that a bright overlap of labeled mitochondria (green) and axon terminals (red) was still visible in the optic tectum 1 day after ONC, both fluorescent signals were almost absent at 3 dpi. The axonal labeling as well as the GFP+ mitochondria reappeared to some extent at 6 dpi and baseline axonal/mitochondrial expression was restored from 10 dpi onwards. Note that the lower row panel shows the merged images, including counterstained nuclei using DAPI (blue). (C) Quantification of the MitoeGFP+ area in the SO and SFGS of the optic tectum confirmed that nearly all mitochondria were removed at 3 dpi, but that they gradually returned from 6 dpi onwards. Data represent the mean ± SEM, n = 4–5 fish per condition, one-way analysis of variance and Tukey’s post hoc test. Scale bars: 25 µm. DAPI: 4′,6-Diamidino-2-phenylindole; Dpi: days post-injury; GFP: green fluorescent protein; MitoeGFP: mitochondrial targeting sequence fused to enhanced GFP; ONC: optic nerve crush; RFP: red fluorescent protein; SGC: stratum griseum centrale; SFGS: stratum fibrosum et griseum superficiale; SO: stratum opticum; S/S: zone between album centrale and stratum periventriculare; TagRFP: membrane tag fused to RFP. |
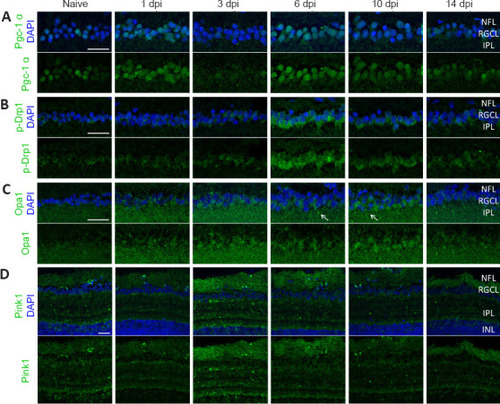
Immunofluorescent stainings for Pgc-1α, p-Drp1, Opa1, and Pink1 on cryosections of WT retinas, harvested at baseline (naive) or after ONC injury. (A) Representative images of retinal cryosections at various time points after ONC stained for Pgc-1α (green), reveal an increased expression of the biogenesis marker in RGC somas at 1 day post optic nerve damage, as well as from 6–10 dpi. (B) Fission was increased in RGC somas from 3–10 dpi, with the highest visible expression at 6 dpi, as shown using the p-Drp1 marker (green). (C) Stainings for Opa1 (green) at various time points after ONC do not show major differences in expression over time, although a marginal increase in Opa1 fluorescence was observed in the RGCL, which seems sporadically clustered in primary RGC dendrites close to the RGCL (arrows). (D) Lastly, mitophagy, visualized via immunostaining for Pink1, was increased at 3 and 6 dpi in both the NFL and IPL. In all panels, upper row images include the DAPI counterstaining (blue). Scale bars: 25 µm, representative images of n = 4 fish per condition. Dpi: Days post-injury; IPL: inner plexiform layer; NFL: nerve fiber layer; ONC: optic nerve crush; Opa1: optic atrophy 1 protein; p-Drp1: phosphorylated Drp1; Pgc-1α: proliferator-activated receptor gamma co-activator 1; Pink1: phosphatase and tensin homologue-induced putative kinase 1; RGCL: retinal ganglion cell layer. |

Quantification of tectal (re)innervation in WT, Drp1 OE, and Drp1 DN zebrafish at 6 days post-ONC (overview images and high magnification images from boxed areas). (A) Representative overview and detailed images (box), as well as semi-quantitative analysis of the tectal area covered by RGC axons reveal a significant reduction in optic tectum reinnervation at 6 days after ONC in the Drp1 OE condition, as compared to WT fish. (B) In Drp1 DN zebrafish, tectal reinnervation was enhanced, in comparison to WT animals. Scale bars: 200 µm. Data represent the mean ± SEM, n = 4–6 fish per condition, one-way analysis of variance followed by Tukey’s post hoc test. DN: Dominant negative; Dpi: days post-injury; Drp1: dynamin-related protein 1; OE: overexpression; ONC: optic nerve crush; WT: wild-type. |