
- Title
-
CD146 increases stemness and aggressiveness in glioblastoma and activates YAP signaling
- Authors
- Liang, Y., Voshart, D., Paridaen, J.T.M.L., Oosterhof, N., Liang, D., Thiruvalluvan, A., Zuhorn, I.S., den Dunnen, W.F.A., Zhang, G., Lin, H., Barazzuol, L., Kruyt, F.A.E.
- Source
- Full text @ Cell. Mol. Life Sci.

CD146 expression in glioma patients and in GBM cells. A Comparison of CD146 mRNA expression in normal human brain to GBM tissues using TCGA brain cancer database. Box plots were derived from gene expression data compared in ONCOMINE (p = 1.30E−4, fold change: 2.675). B Relative CD146 mRNA levels in grade II, grade III, and grade IV glioma; in astrocytoma, oligoastrocytoma, and GBM (C); in IDH-mutant glioma vs IDH wildtype (D); MGMT promoter methylated glioma vs the unmethylated subtype (E). F Kaplan–Meier plots derived from CGGA database showing significant differences in overall survival between low and high CD146 expression in glioma patients (G); Kaplan–Meier plot showing overall survival between low and high CD146 expression of GBM patients (H, I). Kaplan–Meier plot showing overall survival between low and high CD146 expression of glioma patients who received radiotherapy (± chemo) (H) and chemotherapy (± RT) (I). J Representative phase contrast microscopic images of indicated GBM neurospheres (NSP) cultured in serum-free medium (upper) or adherent serum-differentiated (Diff) counterparts (lower) (scale bars = 200 μm). K Western blots showing variable CD146 protein expression in GBM neurospheres that is increased upon serum differentiation. GBM cell lines U-87MG and U-251MG are also included. L Relative CD146 mRNA levels determined in by qRT-PCR in GBM neurospheres and serum-differentiated cells. Data represent the mean of triplicate experiments ± SEM, *p < 0.05; **p < 0.01; ***p < 0.001 by Student’s t test |

CD146 regulating mesenchymal properties in GBM cells. A Representative phase contrast microcopy images of U-87MG cells treated with TGFβ (10 ng/ml) for 0 h, 24 h, 48 h, and 96 h showing induction of a spindle-shaped, stretched out mesenchymal morphology (scale bars = 200 μm). B Western blots showing TGFβ-induced expression of p-Smad2 and mesenchymal markers Fibronectin, ZEB1, Twist1, and CD146 in U-87MG cells. C, D Phase contrast and immunofluorescent microscopic images of GG16 cells ectopically overexpressing GFP (control) or a CD146/GFP fusion protein in spheroids and serum-differentiated cells (scale bars = 200 μm). E Phase contrast microscopic images of differentiated GG16 or GG16 CD146 overexpressing cells (scale bars = 200 μm). F Overexpression of CD146/GFP in GG16 cells is accompanied by increases in ZEB1, N-cadherin, and β-catenin protein levels as measured by Western blotting. G Transwell migration assays demonstrate increased migration in CD146/GFP overexpressing GG16 cells compared to GG16-GFP control cells (scale bars = 400 μm). H Representative images of cells on Transwell membranes and quantified data are presented. Data represent the mean of triplicate experiments ± SEM, ***p < 0.001 by Student’s t test. I. Two independently generated GSC23-CD146-ko cells cultured in serum differentiation conditions have reduced expression of mesenchymal markers ZEB1, N-cadherin, and β-catenin compared to control cells as detected by Western blotting. J Representative images of Transwell migration assay membranes (scale bars = 400 μm) and K quantified data comparing GSC23 control and GSC23-CD146-ko cells, ***p < 0.001 by Student’s t test |
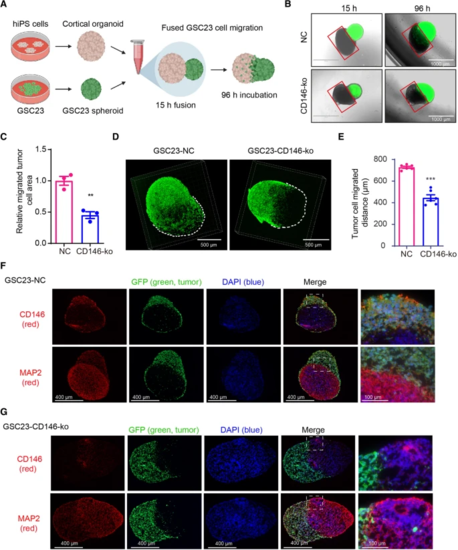
GSC23-CD146 knockout cells have reduced migration/invasion capacity in a GBM-cortical assembloid model. A Schematic outline of the generation of GBM-cortical assembloids to determine migration and invasion capacity. B Representative fluorescent microscopic pictures of GSC23-NC (control) and GSC23-CD146-ko (green) GBM-cortical assembloids at different time points after fusion (scale bars = 1000 μm). The red squares indicate the organoid area largely negative for GFP positive cells, and were used to quantify migration/invasion of GSC23 cells (see methods). C Quantification of migration/invasion by determining ratios GFP positive vs. negative areas, indicating reduced migration/ invasion of GSC23 CD146-ko cells. D Representative confocal immunofluorescent microscopic 3D images of the neurosphere-cortical assembloids 4 days post-fusion. E Distance quantification of migrated GFP positive tumor cell in the GBM-cortical assembloid. Immunofluorescence microscopic images of GFP-labeled (green: GSC23 cells) GSC23 (F) and GSC23-CD146-ko GBM-cortical assembloids (G) stained for CD146 and the neuronal marker MAP2 (labeled red). Nuclei (blue) were stained with DAPI. Scale bars = 400 μm (left), scale bars = 100 μm (right). **p < 0.01, ***p < 0.001 by Student’s t test |

GSC23-CD146 knockout cells showing reduced migration/invasion in a heterotopic xenograft zebrafish model. A Schematic outline of the zebrafish PVS xenograft procedure. GSC23 control and GSC23-CD146-ko neurospheres were dissociated and stained with a green fluorescent dye (CMFDA) prior to injection into the perivitelline space (PVS) at 25–28 h post-fertilization (hpf) in Casper (transparent) zebrafish embryos. Xenografted embryos were assessed and fixed for further analysis at several time points after transplantation. B Representative fluorescence stereomicroscope images of a live zebrafish embryo containing either xenografted GSC23 control (top row) or CD146-ko (bottom row) cells at 2 hpt (left column) and 24 hpt (right column). Shown are overlays of transmission light/fluorescence (top image), fluorescence channel only (middle image), and magnifications of indicated regions of the embryo (bottom images). Arrowheads indicate sparse individual GSC23 cells. C Qualitative assessment of the proportion of embryos with differential location of control (pink) versus CD146-ko (blue) GSC23 cells (see schematic drawing). Light gray indicates embryos with cells only in the PVS, dark gray indicates embryos harboring cells in the PVS and in the embryo proper (tail, trunk, head). Results are from N = 3 independent experiments with total n of embryos indicated above the bars, in which embryos that died between 2 and 24 h or without successful engraftment at 24 h were excluded from the 24 h bars. D Representative maximum projection confocal images of fixed xenografted embryos at 3 dpt with nuclei stained with DAPI (blue) and anti-human nucleoli antibody (green) to visualize the GSC23 cells. The images show a ventral view of the jaw, heart, and anterior yolk region of the embryos where the PVS tumors are located. Anterior is to the top left and posterior to the bottom right. E Qualitative assessment (categorization) of GSC23 PVS tumor morphologies in control (pink) and CD146-ko (blue) xenografts at 1 and 3 dpt. These categories were as follows: (1) delineated (white, striped), defined as compactly packed tumor with defined border with fewer than 10 cells outside the tumor; (2) delineated + interspersed (light gray), a compact delineated tumor with more than 10 interspersed or clustered cells outside the tumor; (3) delineated/loose (middle gray), a tumor that is partially compact with clear boundary and partially loose; and (4) loose (dark gray), a tumor with clear intercellular distances and absence of defined tumor boundary (E). Results are from N = 3 independent experiments with total n of embryos indicated above the bars. Scale bars in B = 250 μm; scale bars in D = 100 μm |

CD146 promotes stemness in GBM cells. A Western blots showing increased expression of SOX2 and Oct-4 in CD146/GFP overexpressing GG16 neurospheres (NSP) and differentiated cells (Diff). B Representative images of GG16 control and GG16-CD146/GFP colonies in colony formation assay showing more dispersed cells in CD146 overexpressing cells (scale bars = 200 μm). C Quantified data of colony numbers in GG16 control compared with CD146/GFP overexpressing GG16 cells for 2000 cells plated. D, E Representative images (scale bars = 400 μm) and quantified data of GG16 control or CD146/GFP overexpression neurospheres in limiting dilution assays. F Western blots showing reduced SOX2 and Oct-4 expression in two different GSC23-CD146-ko cells compared to control serum-differentiated cells. G, H Representative images and quantified data of GSC23 control and two different GSC23-CD146-ko neurospheres in limiting dilution assay. CD146 loss reduces neurosphere formation potential (scale bars = 200 μm). I, J Representative images and quantified data of differentiated GSC23 control vs GSC23-CD146-ko in colony formation assays. CD146 loss reduces colony formation potential in differentiated GSC23 cells. *p < 0.05; **p < 0.01; ***p < 0.001 by Student’s t test |

CD146 increasing radioresistance in GG16 cells. A, B GG16 control (pCMV-GFP) and CD146/GFP overexpressing cells were untreated or exposed to different doses of ionizing radiation (IR) and colony forming potential was monitored. Representative images of plates with colonies and survival curves are shown, **p < 0.01 by Student’s t test. C Western blots showing effect of 4 Gy IR in time on expression of CD146 and indicated DDR, and cell cycle regulatory proteins in GG16 GFP control and GG16-CD146/GFP cells cultured as differentiated cells. Endogenous CD146 expression is induced by radiation, and overexpression of CD146/GFP is associated with prolonged CHK1 induction, suppression of p53, and increased NF-kB signaling |
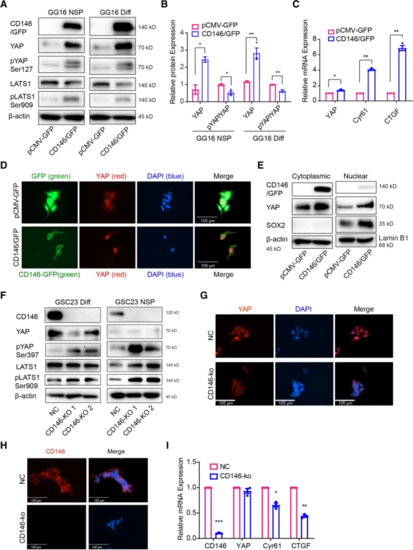
CD146 activating YAP signaling activity. A Protein levels of CD146 and Hippo/YAP pathway molecules were determined by Western blotting in GG16 GFP control (pCMV-GFP) and CD146/GFP overexpressing cells under neurospheres (NSP) and differentiated conditions (Diff). CD146 induced YAP expression accompanied by increased phosphorylation of YAP and LATS. B Bar graphs showing relative levels of YAP normalized to β-actin (loading control) together with ratio of pYAP (inactive)/YAP (active). The ratio decreased in CD146 overexpressing cells suggesting increased YAP activity. C The mRNA levels of YAP, CYR61, and CTGF were detected by qRT-PCR, indicating YAP activation by CD146. D Immunofluorescence microscopic images of GG16-GFP or GG16-CD146/GFP cells stained for YAP (red) and nuclei (blue; scale bars = 100 μm); green signal (GFP or CD146-GFP). Nuclear YAP was enhanced by CD146/GFP overexpression. E Western blotting of cytoplasmic and nuclear extracts showing levels of CD146, YAP, and SOX2 in serum-differentiated GG16 GFP control and CD146/GFP cells. CD146 increased YAP levels in both fractions. β-actin used as loading control of cytoplasmic fractions and Lamin B1 for nuclear fractions. SOX2 was included as additional control for purity of extracts. F Western blots detecting CD146, YAP, and Hippo pathway proteins in serum-cultured and neurospheres GSC23 control and CD146-ko cells. CD146 loss reduces YAP expression and increases pLATS and pYAP levels. G Immunofluorescence microscopic images of GSC23 control and GSC23-CD146-ko serum-cultured cells depicting cytoplasmic (inactive) and nuclear (active) YAP (red). Nuclei are counterstained with DAPI (blue). Loss of CD146 reduces nuclear YAP (scale bars, 100 μm). GSC23 control cells showed nuclear YAP, whereas in CD146-ko cells a clear cytoplasmic shift of YAP was detected. H Immunofluorescence of differentiated GSC23 or GSC23 CD146 knockout cells stained for CD146 (red) and nuclei (blue; scale bars, 100 μm). Membranous CD146 is detected in control cells, absent in CD146-ko cells. I qRT-PCR analyses of YAP target genes CYR61 and CTGF showing reduced expression in GSC23-CD146-ko cells. *p < 0.05, **p < 0.01 by Student’s t test |