
- Title
-
Pentachloronitrobenzene Reduces the Proliferative Capacity of Zebrafish Embryonic Cardiomyocytes via Oxidative Stress
- Authors
- Fan, G., Shen, T., Jia, K., Xiao, X., Wu, Z., Gong, F., Lu, H.
- Source
- Full text @ Toxics

The phenotype of embryos treated with PBCN. (A). Bright field images of the whole body and heart and fluorescence microscope images of the heart. (B,C). Under different concentrations of PCNB, 24, 48, 72 hpf, the survival rate and hatching rate of embryos. (D–F). A statistical graph of the embryo’s body length, heart rate, and atrioventricular distance after 72 h of treatment with different concentrations. SV-BA refers to the distance from the atrium to the ventricle, the red arrow in the figure points. (n = 3, Means ± SD. Scale bar: 500 μm/100 μm). |
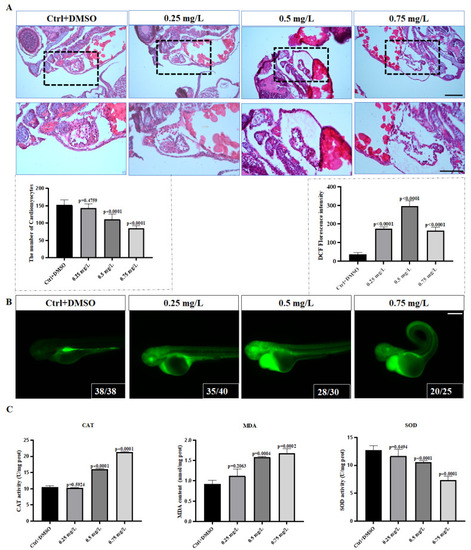
Hematoxylin-Eosin staining image and PCNB causes oxidative stress in the body. (A). Comparison of H&E staining in the control group and H&E staining in the PCNB treatment group. (B). Reactive oxygen species staining images of different treatment groups. (C). Malondialdehyde content, CAT activity, and SOD activity. Each difference is a comparison between the control group and the treatment group. (n = 3, Means ± SD. Scale bar: (A) 50 μm/25 μm. (B) 300 μm). |

Pentachloronitrobenzene inhibited cardiac proliferation. (A). Cardiac proliferation in the Ctrl group (orange represents proliferating cells). (B). Cardiac proliferation in the 0.75 mg/L treatment group. (C). Expression levels of heart-related genes. (D). Cell proliferation-related gene expression. Each difference is a comparison between the control group and the treatment group. (n = 20, Means ± SD). |

Astaxanthin rescued the oxidative stress caused by PCNB. (A). Bright field phenotypes and heart fluorescence images of the control group, medium concentration group, and AST rescue medium concentration group. (B). ROS-stained image of AST rescue. (C). MDA content, CAT activity, SOD activity. (D). Oxidative stress related gene expression level. Each difference is a comparison between the control group and the treatment group. (n = 3, Means ± SD. Scale bar: (A) 500 μm/100 μm. (B) 500 μm). |

Astaxanthin rescued the expression of genes related to heart and cell proliferation. (A). H & E staining images of control group, medium concentration group, and AST rescue medium concentration group. (B). The result of immunofluorescence staining after adding AST to rescue. (C). AST rescued heart-related gene expression. (D). AST rescued cell proliferation related Gene expression status. Each difference is a comparison between the control group and the treatment group. (n = 20, Means ± SD. Scale bar: (A) 50 μm/25 μm). |