
- Title
-
Oxidative stress from DGAT1 oncoprotein inhibition in melanoma suppresses tumor growth when ROS defenses are also breached
- Authors
- Wilcock, D.J., Badrock, A.P., Wong, C.W., Owen, R., Guerin, M., Southam, A.D., Johnston, H., Telfer, B.A., Fullwood, P., Watson, J., Ferguson, H., Ferguson, J., Lloyd, G.R., Jankevics, A., Dunn, W.B., Wellbrock, C., Lorigan, P., Ceol, C., Francavilla, C., Smith, M.P., Hurlstone, A.F.L.
- Source
- Full text @ Cell Rep.

Figure 1. DGAT1 amplification and up-regulation is associated with poor prognosis in melanoma (A) Patient survival from TCGA melanoma cohort (25% top versus 75% bottom by mRNA abundance, y axis) versus fold change in mRNA expression of lipid metabolism genes in zebrafish tumors (x axis). (B) Kaplan-Meier survival plot comparing melanoma patients based on expression of DGAT1 or DGAT2 (top 25% versus bottom 75%, TCGA dataset). (C) DGAT1 and DGAT2 relative gene expression in skin, nevi, and melanoma tumors from indicated studies. Mean ± SD, n > 3. ∗p < 0.05, ∗∗p < 0.01, and ∗∗∗p < 0.001. (D) Protein expression of DGAT1 and vinculin (loading control). NHM, normal human melanocytes. (E) Genetic alterations in the TCGA firehose legacy melanoma dataset (counting only samples with CNV data) obtained from cBioPortal. (F) Schematic depicting human chromosome 8, the amplified arm (red), and known/putative melanoma oncogenes within this region. (G) G-score of amplified regions of zebrafish chromosomes found in BRAFV600E-positive; tp53 mutant tumors indicating the position of presumed melanoma oncogene homologs. (H) Kaplan-Meier progression free-survival plot comparing patients across multiple cancer types based on DGAT1 amplification. |
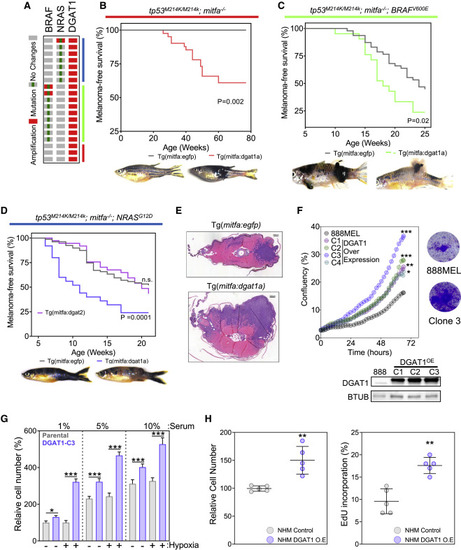
Figure 2. DGAT1 functions as an oncoprotein in zebrafish and human melanocytes (A) DGAT1 amplification distribution in TCGA melanoma samples. (B) Kaplan-Meier plot of melanoma tumor nodule incidence in EGFP control or Dgat1a over-expressing animals on the tp53 mutant;nacre genetic background. Representative images shown for EGFP- and Dgat1a-positive animals at 54 and 76 weeks post-fertilization, respectively (mitfa:egfp n = 20; mitfa:dgat1a n = 20). (C) As for (B) but on the transgenic mitfa:BRAFV600E;tp53 mutant;nacre genetic background. Representative images are shown at 12 weeks post-fertilization (mitfa:egfp n = 46; mitfa:dgat1a n = 21). (D) As for (C) but on the transgenic mitfa:NRASG12D;tp53 mutant;nacre genetic background, also shown the effect of Dgat2 over-expression (mitfa:egfp n = 120; mitfa:dgat1a n = 69; mitfa:dgat2 n = 35). (E) Hematoxylin and eosin-stained transverse sections of EGFP-expressing or Dgat1a-over-expressing melanoma on the transgenic mitfa:NRASG12D;tp53 mutant;nacre genetic background. Scale bars, 200 μm (F) Confluence of parental 888MEL cells and cells following lentiviral transduction with a DGAT1 over-expression vector and clonal selection (mean, n = 3, top left). Corresponding crystal violet staining after 72-h growth (top right). Corresponding protein expression of DGAT1 (bottom). (G) Relative cell numberof parental 888MEL cells and cells following lentiviral transduction with a DGAT1 over-expression vector, determined using crystal violet staining following 48-h culture in indicated serum levels under hypoxic (1% O2) or normoxic conditions (mean ± SEM, n > 3). (H) Relative cell number of NHM and NHM following lentiviral transduction with a DGAT1 over-expression vector determined using crystal violet staining (left). Percentage of NHM and NHM following lentiviral transduction with a DGAT1 over-expression vector in S-phase by using EdU incorporation (right) (mean ± SEM, n = 5). (F–H) For significance: ∗p < 0.05, ∗∗p < 0.01, and ∗∗∗p < 0.001. PHENOTYPE:
|
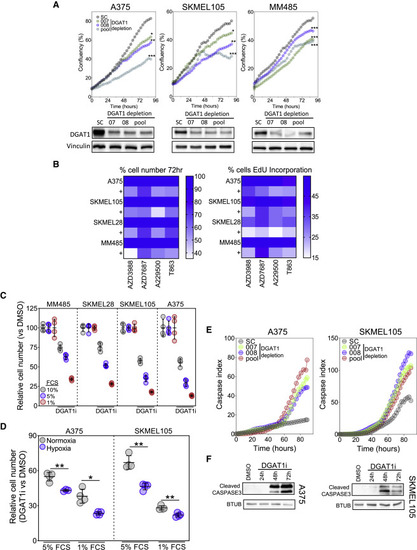
igure 3. DGAT1 antagonism decreases melanoma cell proliferation and survival (A) Confluence of cell lines transfected with DGAT1 targeting (007, 008, pool) or scrambled (sc) siRNAs (mean, n = 3, top). Corresponding protein expression of DGAT1 (bottom). (B) Left: relative cell number (mean, n > 3) in indicated cell lines determined by crystal violet following 72-h DGAT1 inhibitor treatment (50 μM AZD3988, 30 μM A922500, 50 μM AZD7687, or 70 μM T863). Right: percentage of cells in S-phase by using EdU incorporation following 24-h DGAT1 inhibitor treatment (mean, n > 3). (C) Relative cell number determined by crystal violet staining following 72-h A922500 treatment with cells grown in varying concentrations of fetal calf serum (FCS; mean ± SD, n > 3). (D) Relative cell number determined by crystal violet staining following 48-h A922500 treatment under normoxic or hypoxic conditions (1% O2) with cells grown in varying concentrations of FCS (relative to DMSO control for each condition; mean ± SD, n > 3). (E) Cleaved caspase index in indicated cell lines following transfection with either a DGAT1-targeting siRNA (007, 008, pool) or a sc control (mean, n = 3). (F) Protein expression of cleaved caspase-3 following treatment with/without A922500 for 24–72 h. (A) and (D) For significance: ∗p < 0.05, ∗∗p < 0.01, and ∗∗∗p < 0.001. |
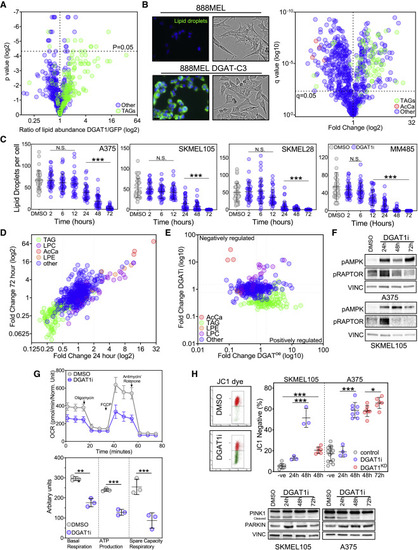
Figure 4. DGAT1-formed lipid droplets act as caretakers of mitochondrial health (A) Lipidomic profiling using UHPLC-MS of NRASG12D-positive EGFP-expressing (n = 6) and NRASG12D-positive Dgat1a-over-expressing (n = 6) tumors showing the ratio of individual lipid species annotated by MS/MS. (B) Representative images of 888MEL and Clone 3 cells stained with BODIPY (left; scale bar, 10 μm). Brightfield images of 888MEL parental cells and Clone 3 DGAT1-over-expressing cells (middle). UHPLC-lipidomic analysis of 888MEL parental and Clone 3 DGAT1-over-expressing cells. Fold change relative to 888MEL parental cells (right) (all conditions n = 3). TAG, triacylglycerides; AcCa, acylcarnitine. (C) Number of lipid droplets per cell visualized using BODIPY staining following AZD3988 (DGAT1i) treatment (mean ± SD, n > 30). (D) UHPLC-lipidomic analysis of SKMEL105 cells following A922500 treatment. Fold change relative to DMSO (all conditions n = 3). TAG, triacylglycerides; LPC, lysophosphatidycholine; LPE, lysophosphatidylethanolamine. (E) Lipid species fold changes in SKMEL105 following 72-h A922500 treatment plotted versus lipid species fold changes observed in Clone 3 cells. (F) Protein expression of phospho-AMPK and phospho-RAPTOR following A922500 (DGAT1i) treatment. (G) Oxygen consumption rate in A375 cells following 48-h A922500 treatment (top). Basal respiration, ATP production, and spare respiratory capacity were calculated (bottom) (mean ± SD, n = 3). (H) Staining with JC-1 dye following A922500 treatment or following transfection with DGAT1 targeting siRNA. The percentage of cells that lost red aggregates was calculated by using 1 μM CCP as a positive control and comparing this with untreated cells to create two populations of cells for flow cytometry analysis (top; mean ± SD, n > 3). Protein expression of PINK1 and PARKIN following A922500 treatment (bottom). (C, G, and H) For significance: ∗p < 0.05, ∗∗p < 0.01, and ∗∗∗p < 0.001. |
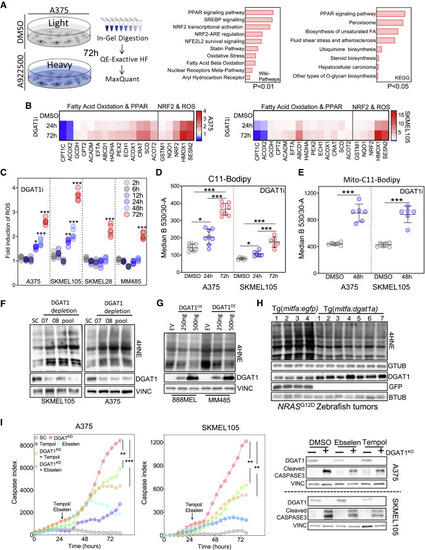
Figure 5. DGAT1 promotes survival of melanoma cells through suppressing ROS generation (A) Total proteomics workflow (left). GEO of up-regulated proteins (114) ranked by combined score (wikipathways) or log-adjusted p values (metascape, right). (DMSO n = 3, A922500 n = 3). (B) RT-qPCR analysis following A922500 treatment. Fold change relative to DMSO (mean, n = 3). (C) ROS levels quantified using dihydroethidium (DHE) fluorescence following A922500 (DGAT1i) treatment. Fold change relative to DMSO (n > 4). (D) C11-Bodipy staining following A922500 treatment. Mean fluorescence determined using FACS (mean ± SD, n > 6). (E) Mito-C11-Bodipy staining following A922500 treatment. Mean fluorescence determined using FACS (mean ± SD, n > 6). (F) 4-Hydroxynonenal (4HNE) protein conjugate abundance and protein expression of DGAT1 following transfection with either DGAT1-targeting siRNA or a scrambled control for 48 h. (G) 4HNE protein conjugate abundance and protein expression of DGAT1 following transfection with either DGAT1 over-expression vector or an empty vector control for 48 h. (H) 4HNE protein conjugate abundance and protein expression of Dgat1 and GFP in NRASG12D-positive EGFP-expressing (n = 4) and NRASG12D-positive Dgat1a-over-expressing (n = 7) tumors. (I) Cleaved-caspase index following transfection of a DGAT1-targeting or scrambled siRNA. At 24 h, cells were treated with/without Tempol or Ebselen (mean, n = 3, outer). Corresponding protein expression of DGAT1 and cleaved caspase-3 (inner). (C–E and I) For significance: ∗p < 0.05, ∗∗p < 0.01, and ∗∗∗p < 0.001. |
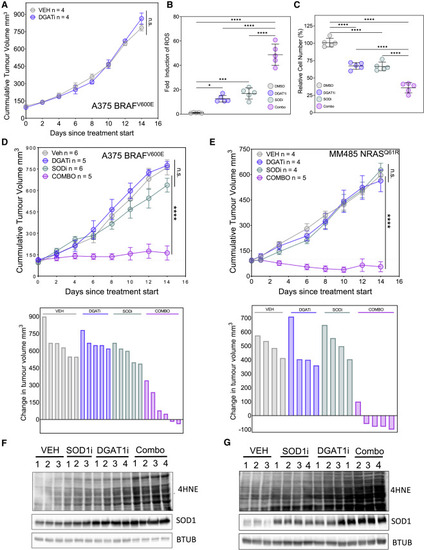
Figure 6. Combined DGAT1 and SOD1 inhibition halts tumor growth (A) Nude mice bearing A375 tumors were treated (n = number of mice per group) with vehicle or A922500 (DGAT1i; 90 mg/kg/day) for 14 days. Data are presented as mean tumor volumes ±SD. (B) Quantification of ROS levels by DHE fluorescence in A375 cells following treatment with either A922500 or ATN-224 (SOD1i) alone or in combination (combo). Fold change relative to DMSO (mean ± SD, n = 5). (C) Relative number of A375 cells following treatment with either A922500 or ATN-224 alone or in combination. Fold change relative to DMSO (mean ± SD, n = 5). (D and E) Nude mice bearing A375 tumors (D) or MM485 tumors (E) were treated (n = number of mice per group) with vehicle, A922500 (90 mg/kg/day) or TTM (SODi; 5 mg/kg/day) alone or in combination for 14 days. Data are presented as mean tumor volumes ±SD (top) or change in individual tumor volume (bottom). (F and G) 4HNE protein conjugate abundance and protein expression of SOD1 in A375 tumors (F) or MM485 tumors (G) treated with vehicle, A922500, or TTM alone or in combination. (B–E) For significance: ∗p < 0.05, ∗∗∗p < 0.001, and ∗∗∗∗p < 0.0001. |
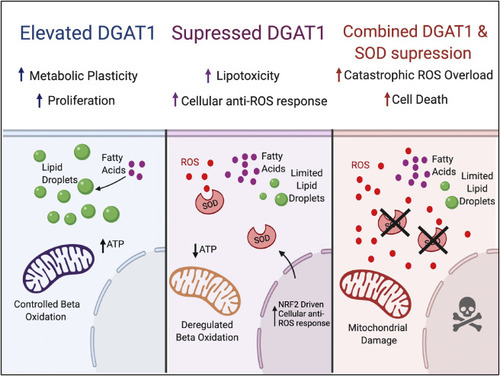
Figure 7. Model Elevation of DGAT1 allows sequestration of fatty acids as triacylglycerides in lipid droplets and a controlled rate of fatty acid oxidation in mitochondria. If DGAT1 is suppressed, then fatty acids are oxidized, and cytotoxic reactive oxygen species are generated. However, these are neutralized through elevation of SOD1. However, if SOD1 is also suppressed, then the build-up of ROS is intolerable, and cells die. |