
- Title
-
Zebrafish Erc1b mediates motor innervation and organization of craniofacial muscles in control of jaw movement
- Authors
- Luderman, L.N., Michaels, M.T., Levic, D.S., Knapik, E.W.
- Source
- Full text @ Dev. Dyn.
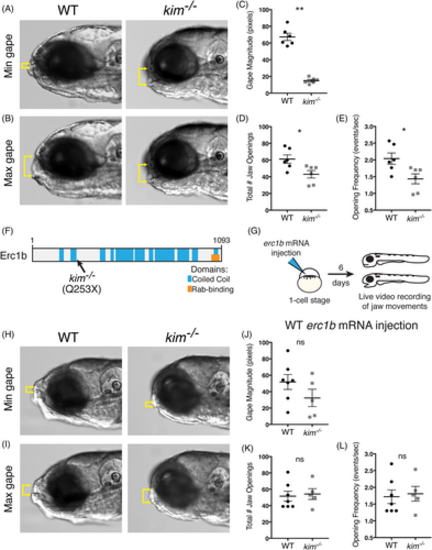
Erc1b deficiency in kimm533 mutant larvae results in jaw movement defects. A, Minimal, and B, maximal lower jaw displacement from 30 s recordings of jaw movements in 6 dpf WT and kim−/− larvae. Yellow brackets indicate mouth gape. C, Quantification of mean mouth gape magnitude, D, total number of jaw openings, and E, jaw opening frequency (openings per second) in WT (n = 6) and kim−/− (n = 6) larvae. F, Schematic of zebrafish Erc1b protein structure, depicting coiled-coil regions and a C-terminal Rab-binding domain; location of kimm533 mutation indicated. G, Experimental design for WT zebrafish erc1b mRNA injections. H, Minimum, and I, maximum lower jaw displacement of 6 dpf WT erc1b mRNA injected WT and kim−/− larvae. J, Quantification of mean mouth gape magnitude, K, total number of jaw openings, and L, jaw opening frequency in WT (n = 7) and kim−/− (n = 5) larvae injected with WT erc1b mRNA. Symbols indicate individual animals, lines indicate mean with SEM. Mann-Whitney U test (two-tailed) was used for statistical analysis, 95% confidence interval. WT, wild-type. *P < .05, **P < .01 |
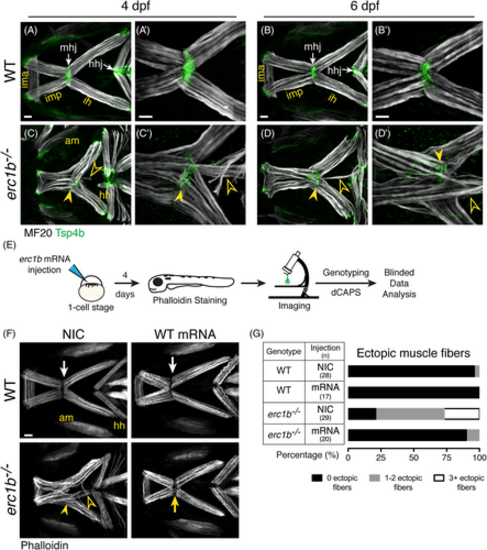
Overexpression of Erc1b rescues ectopic jaw muscle fiber phenotype in Erc1b deficient larvae. Labeling of WT lower jaw muscle fibers with muscle myosin antibody (MF20, white) and myotendinous junction marker (Tsp4b, green, white arrows) at 4 dpf (A [n = 6]) and 6 dpf (B [n = 10]). erc1b−/− larvae at 4 dpf (C [n = 5]) and 6 dpf (D [n = 10]) display partially disorganized lower jaw musculature, including disorganized mhj (closed arrowheads) and 1 to 2 ectopic muscle fibers extending toward the hhj (open arrowheads). A′-D′, Higher magnification images of mhj in individual larvae show severe (3+) ectopic fibers in erc1b−/− larvae, C′-D′. E, Experimental design for zebrafish WT erc1b mRNA injections and subsequent analysis of muscle fiber phenotype. F, Representative images of phalloidin-stained muscles in WT (top) and erc1b−/− (bottom) (4 dpf). NIC erc1b−/− larvae display disorganized mhj (yellow arrowhead) and ectopic muscle fibers (open yellow arrowheads), which are rescued in WT mRNA injected erc1b−/− larvae (yellow arrow). G, Quantification of percent of larvae displaying ectopic muscle fibers. Sample sizes (n) for each genotype and injection denoted in the table. All images are maximum intensity projections; ventral view, anterior to the left. Scale bars = 25 μm. AM, adductor mandibulae; HH, hyohyal; HHJ, hyohyal junction; IH, interhyal; IMA, intermandibularis anterior; IMP, intermandibularis posterior; MHJ, mandibulohyoid junction |
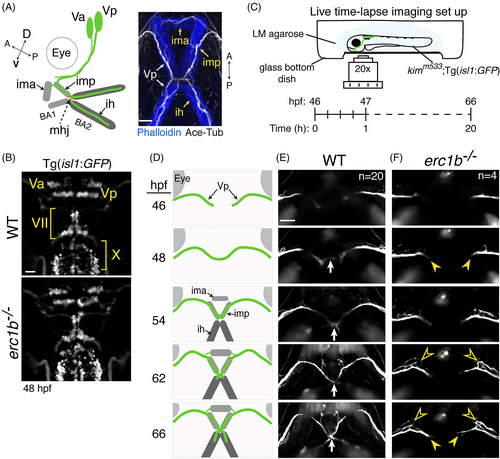
Erc1b deficiency perturbs trigeminal nerve growth. A, Left: schematic of trigeminal motor nerve (Va: anterior trigeminal cluster; Vp: posterior trigeminal cluster) projections into the first (BA1) and second branchial arches (BA2) of zebrafish larvae; IMA: intermandibularis anterior; IMP: intermandibularis posterior; IH: interhyal; MHJ: mandibulohyoid junction. Right: Whole-mount IF of cranial motor nerves (Ace-Tub: acetylated tubulin, white) and lower jaw muscles (phalloidin, blue). Orientation (dorsal (D), ventral (V), anterior (A), posterior (P)) indicated. B, Clusters of cranial motor neurons (Va, Vp: trigeminal; VII: facial; X: vagus) in hindbrain of 48 hours post-fertilization (hpf) WT and erc1b−/− Tg(isl1:GFP) embryos (dorsal view). C, Experimental design for time-lapse imaging of growing trigeminal nerves in transgenic WT and erc1b−/− embryos. Z-stack images were taken every 15 minutes over a 20-hour recording period. D, Schematic of WT trigeminal nerve growth and appearance of lower jaw muscles. E, Stills from time-lapse of trigeminal nerve growth in a WT embryo (ventral view). White arrow indicates midline contact. F, erc1b−/− embryo displays growth delay (yellow arrowheads) and ectopic branching off the anterior side of the trigeminal nerve (open yellow arrowheads). Number of examined animals (n) listed in the first time-lapse images. All images are maximum intensity projections, anterior on top. Scale bars = 25 μm |
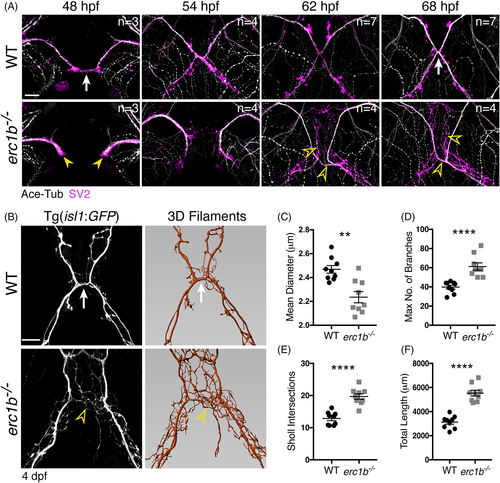
Nerve outgrowth and branching are significantly altered in Erc1b deficient zebrafish. A, Whole-mount IF with antibody labeling acetylated tubulin (white) and SV2 (magenta) in WT and erc1b−/− embryos. White arrow indicates midline contact in WT. Yellow arrowheads indicate delayed trigeminal outgrowth in erc1b−/− embryos. Open yellow arrowheads indicate increased nerve branching in erc1b−/− embryos. Number of examined animals (n) listed in top right of each image. B, Left: images of live transgenic (Tg(isl1:GFP)) WT and erc1b−/− larvae. White arrow indicates nerve branching in WT. Open yellow arrowhead indicates ectopic branching in erc1b−/− larvae. Right: Imaris 3D filament tracing of cranial nerves from images on the left. Quantification of mean diameter of nerve filaments, C, number of filament branches, D, Sholl intersections, E, and total nerve length, F in erc1b−/− and WT larvae. Symbols indicate number of animals (WT n = 9, erc1b−/− n = 9), lines indicate mean with SEM. Mann-Whitney U test (two-tailed) was used for statistical analysis, 95% confidence interval, **P < .01, ****P < .0001. All images are maximum intensity projections, ventral view with anterior on top. Scale bars = 25 μm |
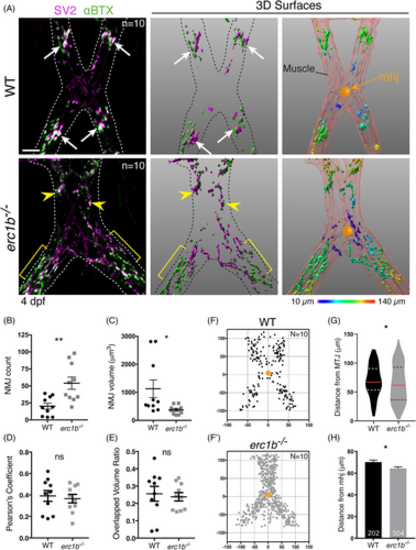
Small, diffusely distributed NMJs appear in Erc1b deficient larvae. A, Left: IF labeling with SV2 (magenta) and αBTX (green); dotted line outlines jaw muscles. Large clusters of NMJs (white arrows) form in WT, erc1b−/− larvae clusters (yellow arrowheads) disperse throughout the tissue (yellow brackets). Middle: Imaris 3D renderings of NMJs. Right: Pseudo-colored NMJs based on the distance from mandibulohyoid junction (mhj, orange ball) (see Section 4 for details). B, Quantification of the number of NMJs, C, NMJ volume, D, SV2/αBTX colocalization Pearson's coefficient, and E, 3D overlap volume ratio in WT and erc1b−/− larvae. Symbols indicate individual embryos (WT N = 10, erc1b−/− N = 10), lines indicate mean with SEM. The location of each NMJ plotted in XY in reference to the mhj (0,0; orange ball) in WT, F, and erc1b−/−, F′, larvae. G, Violin plots of NMJ distance from the mhj (median = red line, upper and lower quartiles = dotted lines). H, NMJ distance to the mhj; bars indicate mean with SEM, total number of NMJs noted at the bottom of each bar (WT n = 202, erc1b−/− n = 504). Mann–Whitney U test (two-tailed) was used for statistical analysis, 95% confidence interval, *P < 0.05, **P < 0.01. All images are maximum intensity projections, ventral views with anterior on top. Scale bars = 25 μm |
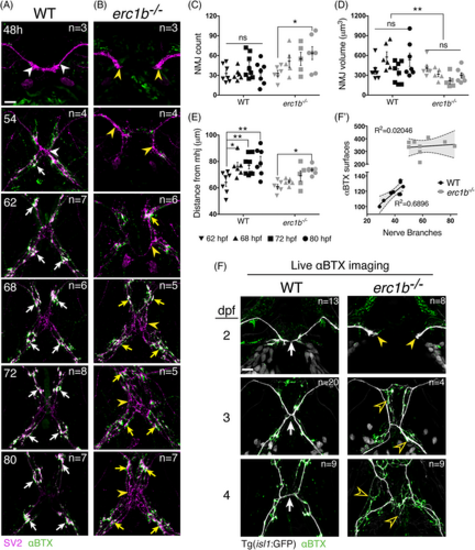
NMJs in Erc1b deficient zebrafish fail to organize during development. A, Sequential NMJ staining of fixed tissue (SV2, magenta; αBTX, green) in WT embryos (timepoints indicated in upper left corner), and B, erc1b−/− embryos. Arrowheads indicate SV2 staining throughout the cranial nerves, and arrows indicate coalescence of SV2/αBTX staining. C-E, Quantification of 3D NMJ renderings in 62-80 hpf animals. Symbols indicate individual animals, lines indicate mean with SEM. Two-way ANOVA with Sidak's multiple comparison was used for statistical significance, **P < .01, *P < .05. F, Representative images of live WT (left) and erc1b−/−/Tg(isl1:GFP) larvae (right) following αBTX incubation. White arrows indicate nerve midline in WT. Yellow arrowheads indicate trigeminal nerve growth tips, and open yellow arrowheads indicate ectopic nerve branching in erc1b−/− larvae. F′, Linear regression of nerve branches and αBTX surfaces in 4 dpf larvae (WT n = 9, erc1b−/− n = 9). Symbols indicate individual animals, with best fit line, R2 values and 95% confidence interval (shaded area). All images are maximum intensity projections, ventral views with anterior on top. Number of examined animals (n) listed in top right of each image. Scale bars = 25 μm |
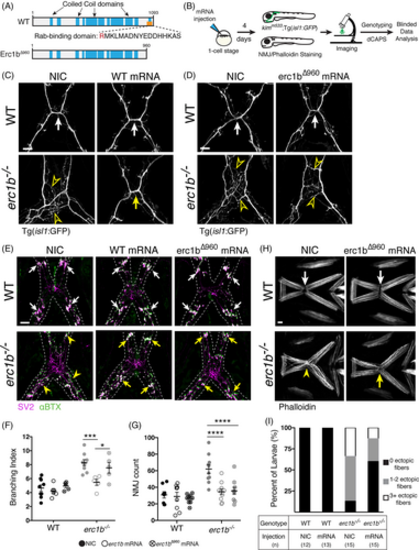
Erc1b Rab-binding domain is required for cranial nerve branching, not for NMJ organization or muscle attachment. A, Schematic of WT zebrafish Erc1b and truncated Erc1bΔ960 constructs, R960 of the Rab-binding domain was replaced with a stop codon. B, Experimental design of mRNA overexpression and imaging of live transgenic or stained larvae for phenotypic analysis. Representative images of live, C, NIC and WT mRNA injected, and D, NIC and erc1bΔ960 mRNA injected WT (top) and erc1b−/−/Tg(isl1:GFP) larvae (bottom). Arrows indicate WT nerve midline crossing; open yellow arrowheads indicate ectopic branching in NIC erc1b−/− larvae. E, Representative images of NMJ (SV2, magenta; αBTX, green) stained NIC, WT mRNA, erc1bΔ960 mRNA injected WT (top), and erc1b−/− larvae (bottom). Arrows indicate NMJ clusters, yellow arrowheads indicate small, dispersed NMJs in NIC erc1b−/− larva. F, Quantification of nerve branching index and G, NMJ count of NIC, WT erc1b mRNA injected, and erc1bΔ960 mRNA injected larvae. Symbols indicate individual animals, lines indicate mean with SEM. Two-way ANOVA with Sidak's multiple comparison was used for statistical significance, *P < .05, ***P < .001, ****P < .0001. H, Representative images of phalloidin-stained muscles in NIC and erc1bΔ960 mRNA injected larvae (WT top, erc1b−/− bottom). Disorganized mhj (yellow arrowhead) in NIC erc1b−/− is rescued by erc1bΔ960 mRNA injection (yellow arrow). I, Quantification of percent of larvae displaying ectopic muscle fibers. Sample sizes (n) for each genotype and injection denoted in the table. All images are maximum intensity projections, ventral views with anterior on top. Scale bar = 25 μm |