
- Title
-
Brasilterpenes A-E, Bergamotane Sesquiterpenoid Derivatives with Hypoglycemic Activity from the Deep Sea-Derived Fungus Paraconiothyrium brasiliense HDN15-135
- Authors
- Wang, W., Shi, Y., Liu, Y., Zhang, Y., Wu, J., Zhang, G., Che, Q., Zhu, T., Li, M., Li, D.
- Source
- Full text @ Mar. Drugs
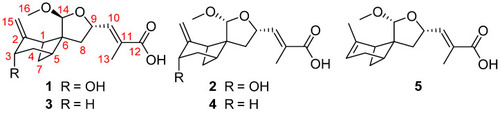
Structures of compounds 1–5. |

Key HMBC and COSY correlations of compounds 1–5. |
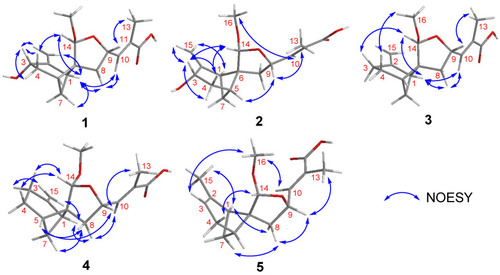
Key NOESY correlations of compounds 1–5. |

Calculated ECD spectra of compounds 1–5 and the experimental ECD curves: (A) ECD spectra of compounds 1 and 2. (B) ECD spectra of compounds 3 and 4. (C) ECD spectra of compound 5. |

ORTEP drawing for the crystal structure of 1 (30% probability ellipsoids). |
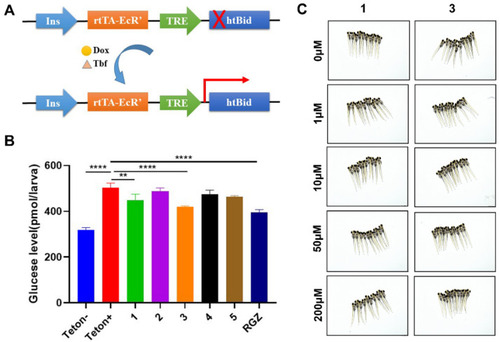
Compounds 1 and 3 had hypoglycemic activity and low toxic effect in zebrafish: (A) Schematic diagram of β-cell ablation of transgenic zebrafish Tg(-1.2ins:htBidTE−ON; LR). In the transgene, the proapoptotic gene human truncated Bid (htBid) is under the control of a TRE-based promoter that is activated by a TE-ON driven by the zebrafish insulin promoter. After incubation with doxycycline (Dox) and tebufenozide (Tbf), the htBid will express and cause β-cell apoptosis. (B) The total free glucose level of 6 dpf Tg(-1.2ins:htBidTE−ON; LR) was treated with 10 μM of different compounds. After induction of the β-cell ablation, 10 μM of each compound was incubated with these larvae individually for 24 h, then their glucose levels were measured. Teton−, without β-cell ablation. Teton+, β-cell ablation without compound incubation. Rosiglitazone (RGZ) was used as a positive control. The values shown are means ± SEM from three independent experiments. ** p < 0.01, and **** p < 0.0001 by one-way ANOVA. (C) Compounds 1 and 3 did not show any toxic effect in zebrafish up to 200 μM, and the concentration of each compound was indicated. |
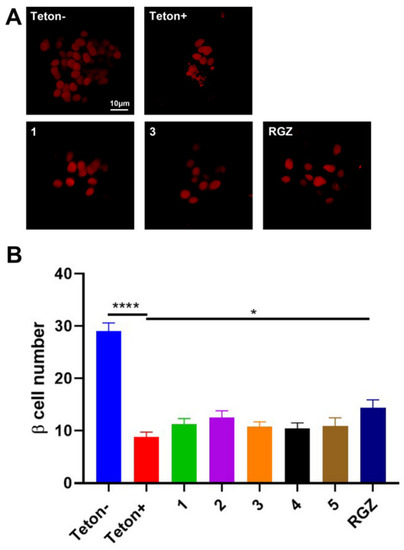
Compounds 1 and 3 did not increase β-cell regeneration: (A) Representative confocal images of the β-cell number from Tg(-1.2ins:htBidTE−ON; LR); Tg(-1.2ins:H2BmCherry) larvae treated with or without 10 μM of compounds. Scale bar indicates 10 μm. (B) Quantification of β-cell number from the larvae treated with or without compounds. Teton−, without β-cell ablation. Teton+, β-cell ablation without compound incubation. Rosiglitazone (RGZ) was used as control. The values shown are means ± SEM from three independent experiments. * p < 0.05, and **** p < 0.0001 by one-way ANOVA. |
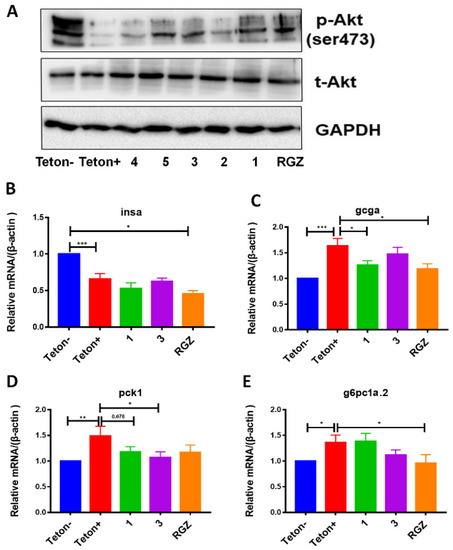
Compounds 1 and 3 improved insulin sensitivity and suppressed gluconeogenesis: (A) Western blot for phosphorylated Akt (p-Akt) and total Akt (t-Akt) in ablated Tg(-1.2ins:htBidTE−ON; LR) larvae treated with or without 10 μM of compounds. GAPDH was used as an internal control. (B–E) Quantitative RT-PCR analysis of the expression of key gluconeogenic genes insa (B), gcga (C), pck1 (D), and g6pc1a.2 (E). Expression of β-actin was used as an internal control for all real-time PCR experiments. Teton−, without β-cell ablation. Teton+, β-cell ablation without compound incubation. Rosiglitazone (RGZ) was used as a control compound. All the values shown are means ± SEM from three independent experiments. * p < 0.05, ** p < 0.01, and *** p < 0.001 by one-way ANOVA. |