
- Title
-
SCN1A overexpression, associated with a genomic region marked by a risk variant for a common epilepsy, raises seizure susceptibility
- Authors
- Silvennoinen, K., Gawel, K., Tsortouktzidis, D., Pitsch, J., Alhusaini, S., van Loo, K.M.J., Picardo, R., Michalak, Z., Pagni, S., Martins Custodio, H., Mills, J., Whelan, C.D., de Zubicaray, G.I., McMahon, K.L., van der Ent, W., Kirstein-Smardzewska, K.J., Tiraboschi, E., Mudge, J.M., Frankish, A., Thom, M., Wright, M.J., Thompson, P.M., Schoch, S., Becker, A.J., Esguerra, C.V., Sisodiya, S.M.
- Source
- Full text @ Acta Neuropathol.
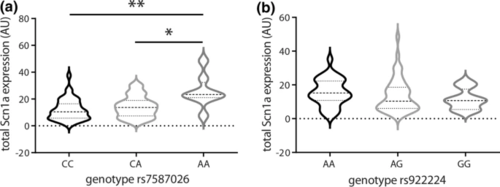
rs7587026 genotype is correlated with SCN1A expression in individuals with MTLEHS, whereas rs922224 genotype is not. a,b Violin plots showing the expression levels of SCN1A in hippocampi of individuals with MTLEHS stratified by SNP genotype. Horizontal lines within the plots present median and quartiles. a Individuals with MTLEHS homozygous for the minor allele (rs7587026) have higher SCN1A expression levels compared to the other two genotypes (CC: n = 43, CA: n = 40, AA: n = 8; Kruskal–Wallis test: **P = 0.004, Dunn’s test: CC vs. AA: **P = 0.003, CA vs. AA: *P = 0.035). b No differences in SCN1A expression levels were observed by rs922224 genotype in MTLEHS (AA: n = 33, AG: n = 46, GG: n = 12; Kruskal–Wallis test: P = 0.226). See Supplementary Table 3 (online resource) for the expression level values |
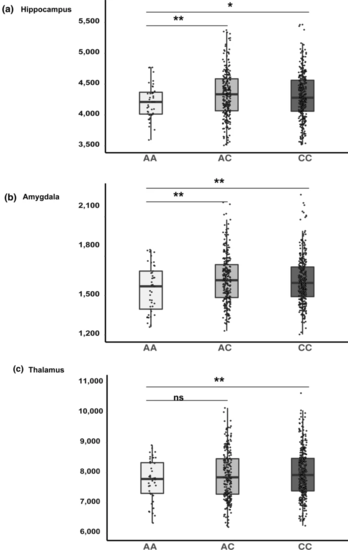
Subcortical volumes by genotype. The mean volumes of the a hippocampus, b amygdala and c thalamus are presented based on rs7587026 genotype in healthy young individuals. The mean volume was calculated from left and right hemisphere structural volumes in mm3. In each figure, the x-axis displays three groups of the QTIM sample based on rs7587026 genotype: minor allele homozygotes (AA; n = 41), minor allele heterozygotes (AC; n = 242), and major allele homozygotes (CC; n = 314). The y-axis displays the structural volume in mm3. Error bars represent standard error (SE) of the means. *P < 0.05; **P < 0.01; ns non-significant |
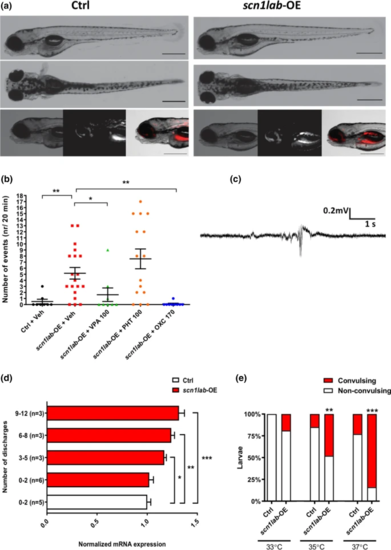
Overexpression of scn1a in zebrafish increases seizure susceptibility and temperature sensitivity. a Representative images of control (Ctrl; left panel) and scn1lab-OE larvae (right panel). Red colour depicts mCherry fluorescence. b Number of EEG discharges in control and scn1lab-OE larvae. Horizontal bars represent mean ± SEM. Sample sizes: Ctrl, n = 8; scn1lab-OE + Veh, n = 19; scn1lab-OE + valproic acid (VPA) (100 µM), n = 8; scn1lab-OE + phenytoin (PHT) (100 µM), n = 15; scn1lab-OE + oxcarbazepine (OXC) (170 µM), n = 9. **P < 0.01, *P < 0.05 (One-way ANOVA with Tukey’s post-hoc). Abbreviations: VPA-valproic acid, PHT-phenytoin, OXC- oxcarbazepine. c An example of EEG recordings obtained from the optic tecta of 4 dpf scn1lab-OE larvae. d Number of discharges recorded in scn1lab-OE larvae relative to scn1lab mRNA levels. Vertical bars represent mean ± SEM. e Percentage of larvae developing heat-induced seizures. Sample sizes: Ctrl, n = 18, n = 20 or n = 22 (for 33, 35 or 37 °C, respectively); scn1lab-OE, n = 16, n = 19 or n = 18 (for 33, 35 or 37 °C, respectively). ***P < 0.001, **P < 0.01 (Two-way ANOVA with Sidak’s multiple comparisons test) PHENOTYPE:
|
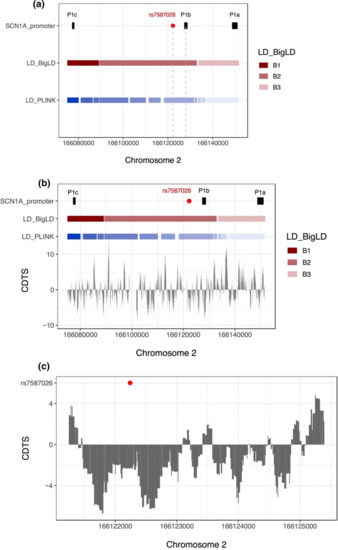
a Chromosomal position of rs7587026 with respect to the three known SCN1A promoter regions. rs7587026 falls within the same LD block as the P1b promoter. X-axis: position on chromosome 2, Y-axis: elements that were considered (SCN1A promoter regions, LD blocks defined using the BigLD function and PLINK). b The top half of the figure shows the genetic position of the three SCN1A promoter regions, rs7587026, as well as a representation of the LD blocks that span the locus; the bottom half shows the sequence constraint level. c Level of sequence constraint of the genetic region surrounding rs7587026. Sequence constraint is expressed as context-dependent tolerance score (CDTS), indicating the likelihood of variation. Negative CDTS scores indicate highly constrained regions, infrequently mutated in healthy individuals and more likely to be functionally relevant |
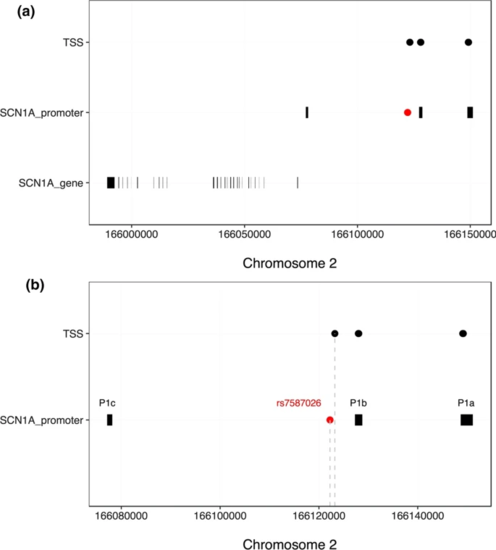
a Transcription start sites (TSSs) identified by the FANTOM5 project, located upstream of the SCN1A gene body. Six TSSs fell within two of the three SCN1A promoters and one TSS was located 981 bp away from rs7587026. b X-axis: genetic positions on chromosome 2, Y-axis: genetic elements that were considered |
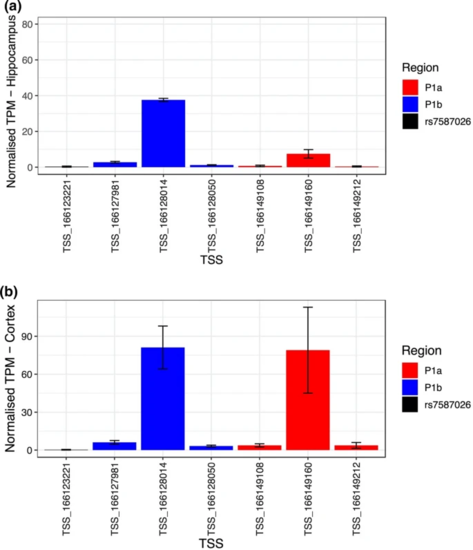
Normalized tags per million (TPM) expression values of the TSSs located upstream of SCN1A in the hippocampus (a) and cortex (b). In red are shown the TSSs located in P1a, in blue the TSSs in P1b and in black the TSS close to rs7587026. The black bars indicate the standard error (SE) of the mean |
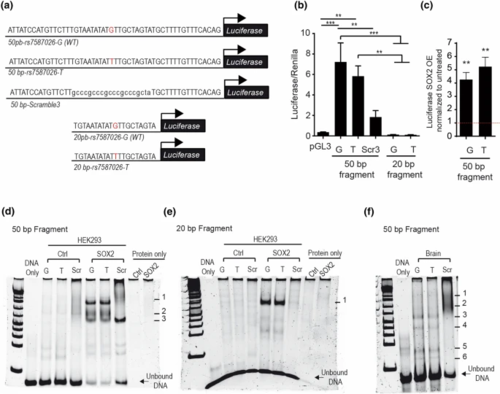
Genomic SCN1A fragment harbouring SNP rs7587026 has promoter activity. a DNA sequence and schematic representation of genomic fragments of SCN1A cloned in luciferase constructs. The 50 bp fragments are denoted as 50 bp-rs7587026-G (WT) (for the major allele/wild type sequence), 50 bp-rs7587026-T for the minor allele sequence and as 50 bp-Scramble3 (for the scramble sequence); the 20 bp fragments are denoted as 20 bp-rs7587026-G (WT) (for the major allele/wild type sequence) and 20 bp-rs7587026-T for the minor allele sequence. b Luciferase activity of NS20Y cells transfected with the 50 bp luciferase fragments with both genotypes and a scrambled sequence (constructs: SCN1A-50 bp-rs7587026-G(WT)-Luciferase, SCN1A-50 bp-rs7587026-T-Luciferase or SCN1A-50 bp-Scramble3-Luciferase) and 20 bp luciferase fragments of both genotypes (constructs: SCN1A-20 bp-rs7587026-G(WT)-Luciferase or SCN1A-20 bp-rs7587026-T-Luciferase). Luciferase values were normalized to Renilla values. Data is represented as mean ± SEM (one-way ANOVA, Tukey’s multiple comparison test, n = 4). c Luciferase activity of NS20Y cells co-transfected with the 50 bp-SCN1A fragments (SCN1A-50 bp-rs7587026-G(WT)-Luciferase or SCN1A-50 bp-rs7587026-T-Luciferase) and pCMV-Sox2-T2A-GFP (50 ng). Luciferase values were normalized to the untreated condition (data is represented as mean ± SEM, n = 4, One sample t test). d,e EMSA performed with HEK293T cells overexpressing pCMV-Sox2-T2A-GFP or hypB-CAG-2A-eGFP (control) with the 50 bp SCN1A fragments (d) and the 20 bp SCN1A fragment (e). Scr denotes scrambled sequences (sequences in Supplementary Table 2, online resource). f EMSA reaction with nuclear protein extracts from mouse brain extract and the 50 bp SCN1A fragments. Numbers denote DNA–protein complexes |