
- Title
-
Bone-targeting carbon dots: effect of nitrogen-doping on binding affinity
- Authors
- Lee, K.K., Lee, J.G., Park, C.S., Lee, S.H., Raja, N., Yun, H.S., Lee, J.S., Lee, C.S.
- Source
- Full text @ RSC Adv.
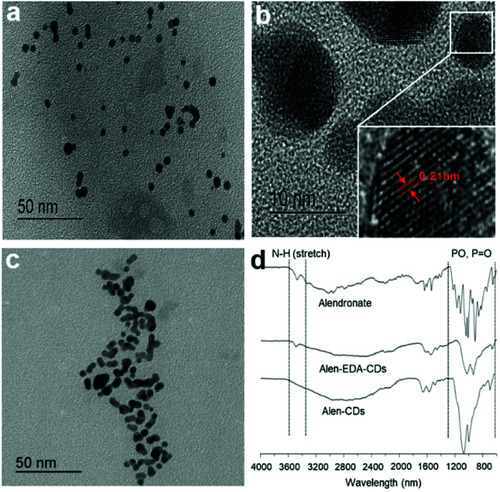
TEM images of (a and b) Alen-CDs, (c) Alen-EDA-CDs, and (d) FT-IR spectra of alendronate, Alen-CDs, and Alen-EDA-CDs. |

(a) XPS spectra for N1s and (b) 31P-NMR spectra. |

(a) UV-vis spectra of alendronate, Alen-CDs, and Alen-EDA-CDs; (b) fluorescence spectrum of Alen-CDs; and (c) fluorescence intensities of Alen-CDs and Alen-EDA-CDs |

Confocal microscopy images (60×, ex; 405 nm/em; 440–470 nm) of HeLa cells treated with 300 μg mL−1 Alen-CDs and Alen-EDA-CDs: (a) control group, (b) Alen-CDs, and (c) Alen-EDA-CDs. |

Fluorescence images of CDHA scaffolds treated with Alen-CDs (300 μg mL−1) and Alen-EDA-CDs (300 μg mL−1) at 37 °C for 12 h. |
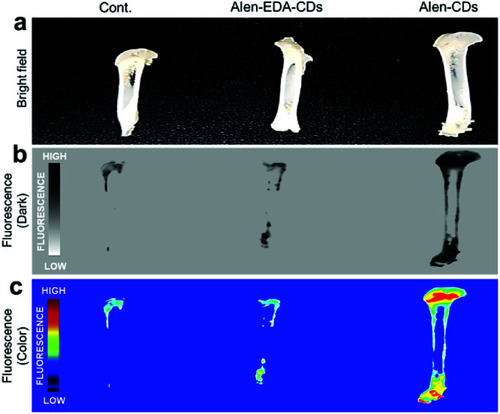
Fluorescence images of rat femurs treated with Alen-CDs (300 μg mL−1) and Alen-EDA-CDs (300 μg mL−1) at 37 °C for 12 h. |

Confocal microscopy images for 6 dpf head skeleton of zebrafish larvae treated with (a and a′) Alen-CDs, (b and b′) Alen-EDA-CDs, and (c and c′) Alizarin Red S. Abbreviations of bones: hyomandibula (hm), opercle (op), ceratobranchial 5 (cb5), cleithrum (cl), entopterygoid (en), branchiostegal ray1 (br1), branchiostegal ray2 (br2). Scale bar = 100 μm. |

Confocal microscopy images of zebrafish larvae with (a and a′) Alen-CDs, (b and b′) Alen-EDA-CDs, and (c and c′) Alizarin Red S at 7 dpi. Abbreviations of bones: hyomandibula (hm), opercle (op), cleithrum (cl), entopterygoid (en), branchiostegal ray1 (br1), branchiostegal ray2 (br2). |
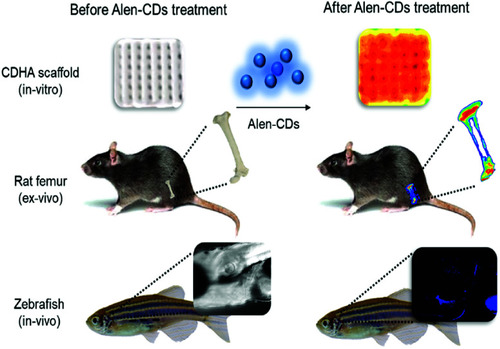
Schematic illustration of fluorescence imaging |

Schematic illustration of the synthesis and bone affinity of Alen-CDs and Alen-EDA-CDs. |