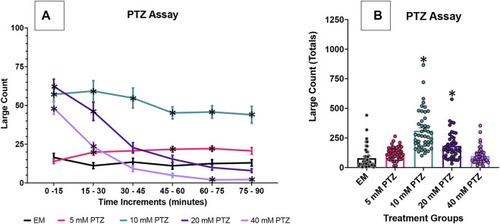
Behavioral profile of zebrafish larvae exposed to PTZ. The following graphs displays the average large count (y-axis) of larvae. (A) The average larval large count is depicted per 15 min interval (x-axis) of the tracking session. Zebrafish larvae were tested PTZ concentrations at 5 mM, 10 mM, 20 mM, and 40 mM (n = 70 fish/solution/concentration). Embryo medium (EM) was used as the control. Significance indicated by *p < 0.05 PTZ vs. EM, two-way ANOVA, Tukey’s post-hoc. (B) The total large count (y-axis) over 90 min is displayed. The respective treatment groups (x-axis). Analyses (one-way ANOVA, Tukey’s post-hoc) are marked * (p < 0.05) to indicate significant differences to embryo medium (EM).

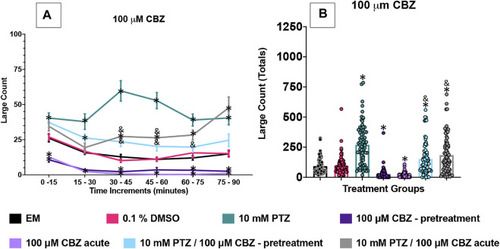
Behavioral profile of zebrafish larvae exposed to carbamazepine (A) displays the average large count (y-axis) of larvae. The average larval large count is depicted per 15 min interval (x-axis) of the tracking session. The respective treatment groups are listed on the x-axis. Analyses (two-way ANOVA, Tukey’s post-hoc) are marked * (p < 0.05) to indicate significant differences to embryo medium (EM). Standard error of the means is shown. Analyses (two-way ANOVA, Tukey’s post-hoc) are marked and (p < 0.05) to indicate significant differences to 10 mM PTZ. (B) The total large count (y-axis) over 90 min is displayed. The respective treatment groups (x-axis). Analyses (one-way ANOVA, Tukey’s post-hoc) are marked * (p < 0.05) to indicate significant differences to embryo medium (EM). Standard error of the means is shown. Analyses (one-way ANOVA, Tukey’s post-hoc) are marked & (p < 0.05) to indicate significant differences to 10 mM PTZ. (n = 76 fish/treatment group).

Behavioral profile of zebrafish larvae exposed to lamotrigine. (A) The average large count (y-axis) of larvae is depicted per 15 min interval (x-axis) of the tracking session. The respective treatment groups are listed on the x-axis. Analyses (two-way ANOVA, Tukey’s post-hoc) are marked * (p < 0.05) to indicate significant differences to embryo medium (EM). Standard error of the means is shown. Analyses (two-way ANOVA, Tukey’s post-hoc) are marked & (p < 0.05) to indicate significant differences to 10 mM PTZ. (B) The total large count (y-axis) over 90 min is displayed. The respective treatment groups (x-axis). Analyses (one-way ANOVA, Tukey’s post-hoc) are marked * (p < 0.05) to indicate significant differences to embryo medium (EM). Standard error of the means is shown. Analyses (one-way ANOVA, Tukey’s post-hoc) are marked & (p < 0.05) to indicate significant differences to 10 mM PTZ. (n = 76 fish/treatment group).

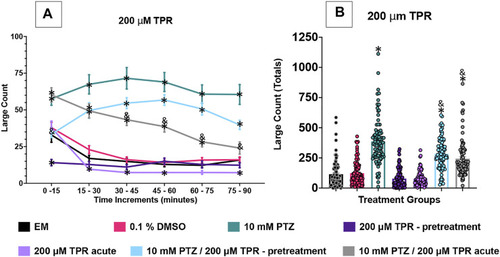
Behavioral profile of zebrafish larvae exposed to topiramate. (A) The average large count (y-axis) of larvae is depicted per 15 min interval (x-axis) of the tracking session. The respective treatment groups (x-axis). Analyses (two-way ANOVA, Tukey’s post-hoc) are marked * (p < 0.05) to indicate significant differences to embryo medium (EM). Standard error of the means is shown. Analyses (two-way ANOVA, Tukey’s post-hoc) are marked & (p < 0.05) to indicate significant differences to 10 mM PTZ. (B) The total large count (y-axis) over 90 min is displayed. The respective treatment groups (x-axis). Analyses (one-way ANOVA, Tukey’s post-hoc) are marked * (p < 0.05) to indicate significant differences to embryo medium (EM). Standard error of the means is shown. Analyses (one-way ANOVA, Tukey’s post-hoc) are marked & (p < 0.05) to indicate significant differences to 10 mM PTZ. (n = 91 fish/treatment group).

Behavioral profile of zebrafish larvae exposed to GS967. (A) The average large count (y-axis) of larvae. The average larval large count is depicted per 15 min interval (x-axis) of the tracking session. The respective treatment groups (x-axis). Analyses (two-way ANOVA, Tukey’s post-hoc) are marked * (p < 0.05) to indicate significant differences to embryo medium (EM). Standard error of the means is shown. Analyses (two-way ANOVA, Tukey’s post-hoc) are marked & (p < 0.05) to indicate significant differences to 10 mM PTZ. (B) The total large count (y-axis) over 90 min is displayed. The respective treatment groups (x-axis). Analyses (one-way ANOVA, Tukey’s post-hoc) are marked * (p < 0.05) to indicate significant differences to embryo medium (EM). Standard error of the means is shown. Analyses (one-way ANOVA, Tukey’s post-hoc) are marked & (p < 0.05) to indicate significant differences to 10 mM PTZ. (n = 60 fish/treatment group).

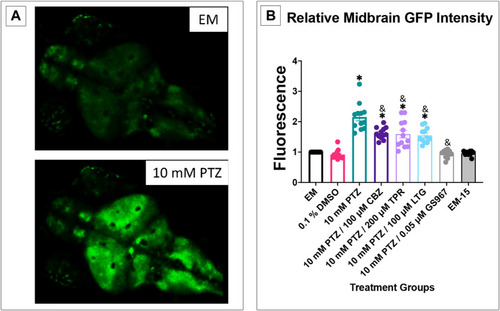
Calcium signaling activity in 7 dpf larvae. The fluorescence score is displayed on the y-axis. The respective treatment groups are shown on the x-axis. Analyses (one-way ANOVA, Tukey’s post-hoc) are marked * (p < 0.05) to indicate significant differences to embryo medium (EM). Standard error of the means is shown. Analyses (one-way ANOVA, Tukey’s post-hoc) are marked & (p < 0.05) to indicate significant differences to 10 mM PTZ. (n = 12 fish/treatment group).

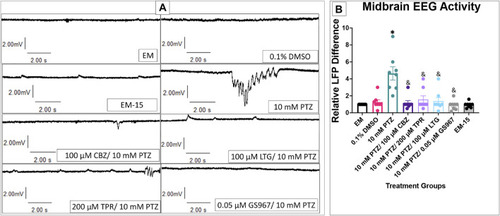
Local field potentials in 7 dpf larvae. (A) Representative tracings recorded in the presence of EM (top) and 10 mM PTZ (bottom) are shown. (B) The relative LFP difference is displayed on the y-axis. The respective treatment groups are shown on the x-axis. Analyses (one-way ANOVA, Tukey’s post-hoc) are marked * (p < 0.05) to indicate significant differences to embryo medium (EM). Standard error of the means is shown. Analyses (one-way ANOVA, Tukey’s post-hoc) are marked & (p < 0.05) to indicate significant differences to 10 mM PTZ. (n = 8 fish/treatment group).

Acknowledgments
This image is the copyrighted work of the attributed author or publisher, and ZFIN has permission only to display this image to its users. Additional permissions should be obtained from the applicable author or publisher of the image. Full text @ Front Pharmacol