
- Title
-
A Comparative Multi-System Approach to Characterizing Bioactivity of Commonly Occurring Chemicals
- Authors
- Rivera, B.N., Wilson, L.B., Kim, D.N., Pande, P., Anderson, K.A., Tilton, S.C., Tanguay, R.L.
- Source
- Full text @ Int. J. Environ. Res. Public Health
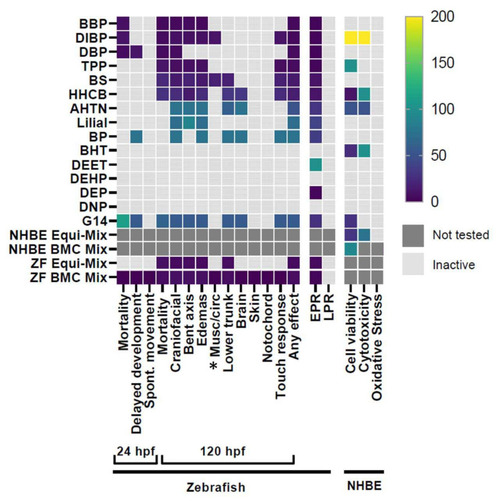
Figure 1. Heatmap of all endpoints across both models for each individual chemical and mixture. Colored boxes represent the lowest concentration to induce a significant effect (LEL) for each endpoint. * = Musc/circ indicates lack of circulation, malformed somites, and/or improper swim bladder formation. LEL values for each endpoint can be found in Table S4. |

Figure 2. Concentration–response curves of HHCB, AHTN, BHT, BMC-anchored (NHBE BMC Mix), and equimolar (NHBE Equi-Mix) mixtures in NHBE. |
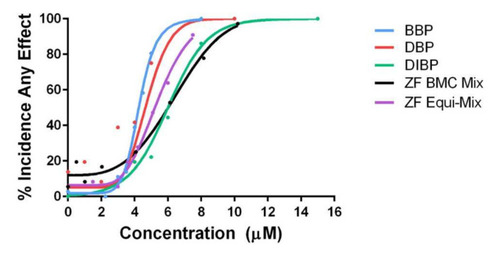
Figure 3. Concentration–response curves of bioactive phthalates and equimolar (ZF Equi-Mix) and BMC-anchored (ZF BMC Mix) mixtures in zebrafish. |

Figure 4. Concentration–response bar plots for incidence of each morphological endpoint from zebrafish bioactivity screening for individual phthalates and equimolar and BMC-based phthalate mixtures. Concentrations across the y-axis for each chemical and mixture are listed in Table 4. |

Figure 5. Correlation matrix investigating co-occurrence of real-world chemical concentrations for the most potent chemicals in (A) zebrafish and (B) NHBE, using exposure concentrations from Dixon et al., 2019, labeled with correlation coefficients. Only chemicals with significant correlations (p < 0.01) are shown. |