
- Title
-
Implementation of Zebrafish Ontologies for Toxicology Screening
- Authors
- Thessen, A.E., Marvel, S., Achenbach, J.C., Fischer, S., Haendel, M.A., Hayward, K., Klüver, N., Könemann, S., Legradi, J., Lein, P., Leong, C., Mylroie, J.E., Padilla, S., Perone, D., Planchart, A., Prieto, R.M., Muriana, A., Quevedo, C., Reif, D., Ryan, K., Stinckens, E., Truong, L., Vergauwen, L., Vom Berg, C., Wilbanks, M., Yaghoobi, B., Hamm, J.
- Source
- Full text @ Front Toxicol

FIGURE 1. Reducing data heterogeneity with ontologies. Different laboratories test the same chemical and observe the same endpoint but report their observations differently according to each laboratory’s internal standard. Mapping these terms to an ontology reduces this heterogeneity and aids in data integration across laboratories. |

FIGURE 2. Example zebrafish larva image from the Vertebrate Automates Screening Technology System. Each survey participant was asked to annotate 24 of these images for each of two surveys. |

Mean rater concordance using general phenotype terms. These boxplots show the mean concordance ( |
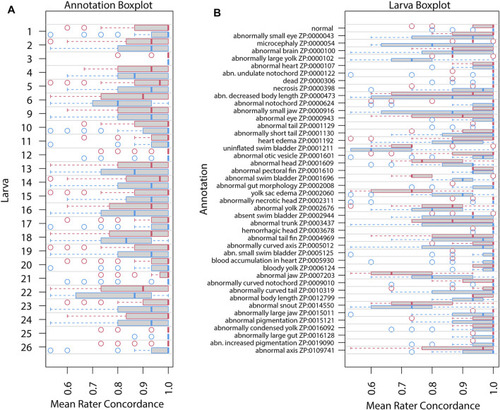
Mean rater concordance using granular phenotype terms. These boxplots show the mean concordance ( |

Concordance change for general phenotype terms. Concordance here represents the frequency for which a particular rater (identified along |

Concordance change for granular phenotype terms. Concordance here means the rater made the same annotation as the majority of raters. The “concordance change” is the difference between the number of concordant calls for Survey 2 and those for Survey 1 (maximum values would range from −24 to 24). An increase in concordance is indicated by blue and a decrease is indicated by red. The annotation and rater labels have the overall mean concordance in parentheses (combines both surveys), and a color-coded change in mean concordance from Survey 1 to Survey 2 just below. Note that the lower bound for the annotation mean concordance is 50%, but the rater lower bound is 0%. Axes are sorted by overall mean concordance values. Significant changes in concordance as determined by Fisher's exact tests are indicated by an asterisk. |
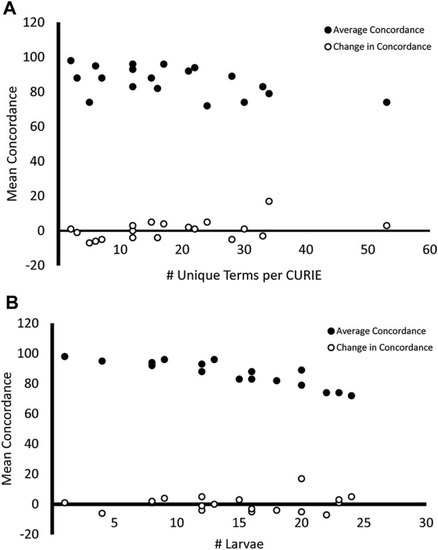
Mean concordance and variability in endpoint reporting. Endpoints that were described using a higher number of unique terms |

Expanding a data set using a knowledge graph. The zebrafish endpoint “microcephaly” can be used to query the Monarch knowledge graph to find relevant genes (rpl11 and rps3a), variants (hi3820bTg), diseases (Diamond-Blackfan anemia), and biological processes (hemopoeisis) to enrich the data set and generate new hypotheses. |