FIGURE SUMMARY
Title

Glyoxylate protects against cyanide toxicity through metabolic modulation

Authors
Nielson, J.R., Nath, A.K., Doane, K.P., Shi, X., Lee, J., Tippetts, E.G., Saha, K., Morningstar, J., Hicks, K.G., Chan, A., Zhao, Y., Kelly, A., Hendry-Hofer, T.B., Witeof, A., Sips, P.Y., Mahon, S., Bebarta, V.S., Davisson, V.J., Boss, G.R., Rutter, J., MacRae, C.A., Brenner, M., Gerszten, R.E., Peterson, R.T.
Source
Full text @ Sci. Rep.

Glyoxylate identified as cyanide antidote in metabolite screen. (A) Schematic of the screening process for cyanide toxicity antidotes. 5 dpf zebrafish were added 3 per well to 96 well plates in E3 buffered with 20 mM HEPES and treated with 30 µM human metabolite and 10 µM KCN. (B) Metabolic map illustrating the breadth of the screen. Of the ~ 500 human-derived metabolites tested, THF and glyoxylate were the only molecules that yielded 24 h survival in both of the duplicate screens other than hydroxocobalamin, the positive control. (C) Hit efficacy plot denoting compound rescue capability. 2 points were assigned for 3 h touch responsiveness and 50 points were assigned for 24 h survival after each of the 2 screens (e.g., a compound that produces 24 h survival in both screens receives a score of 100, one that produces 3 h touch responsiveness in one and 24 h survival in the other receives a score of 52). Each peak represents one compound and its corresponding efficacy score.

Glyoxylate improves survival rates in vertebrate animal models. (A) Percent survival of 5 dpf zebrafish treated with indicated KCN and glyoxylate concentrations, survival assessed 20 h after administration. Fish were arrayed 3 per well. N = 5 wells per glyoxylate concentration in each of the given cyanide conditions. Data are presented as mean ± SEM. (B) Mice were exposed for a total of 40 min to 587 ppm HCN gas in a sealed chamber. At 15 min, the mice were removed and received an intramuscular injection of 60 mg/kg glyoxylate (green line), 120 mg/kg glyoxylate (blue line), or saline (red line), and returned to the cyanide chamber for 25 min. N = 6 for all three groups. There was a significant difference in survival between mice injected with 120 mg/kg glyoxylate and mice injected with saline (***p = 0.0005), but not between mice injected with 60 mg/kg glyoxylate and mice injected with saline (p = 0.15). (C) An LD80 lethal level dose of i.v. NaCN was administered to rabbits. Upon reaching target systolic BP (50 mm/Hg), 11 control rabbits were injected with 2 mL saline and 10 rabbits were given 2 M glyoxylate while the NaCN infusion continued for 30 min to a total dose of 22 mg. Injection of saline or glyoxylate is designated as time t = 0.

Oxygen metabolism is restored following glyoxylate treatment. (A) Oxygen consumption rates of 5 dpf zebrafish treated with DMSO, KCN, or KCN and glyoxylate with the given concentrations (**p < 0.005 using one-way ANOVA). Fish were arrayed 1 per well, N = 4 wells for each condition. (B) Glyoxylate was given i.m. to rabbits 30 min after exposure to i.v. cyanide, and deoxygenated and oxygenated hemoglobin were monitored throughout the timecourse with diffuse optical spectroscopy (DOS). Data from a single representative rabbit are shown. (C) DOS monitoring of cytochrome C oxidase state. Glyoxylate was administered i.m. 30 min after i.v. cyanide infusion started. Results shown for a single rabbit are typical of the response seen by DOS in animals treated with cyanide and glyoxylate.

Glyoxylate’s rescue mechanism is not fully explained by cyanohydrin formation. Dose dependent survival of 5 dpf zebrafish in the presence of (A) scavengers (3 fish per well, N = 6 wells for each condition) or (B) cyanohydrin-forming molecules 20 h after exposure to 20 µM KCN (3 fish per well, N = 6 wells for each condition with the exception of alpha-ketobutyrate, N = 3). Data presented as mean ± SEM. HCP was 100% lethal at the highest dose (1 mM) and this data point was removed to preserve an accurate dose–response curve. (C) Continuous-wave near-infrared spectroscopy (CWNIRS) monitoring changes in concentrations of deoxygenated (RHb), oxygenated (OHb), and total (THb) hemoglobin. The rabbits were exposed to a sublethal dose of 10 mg i.v. NaCN for 60 min. At 60 min, subjects received equimolar doses of glyoxylate or (D) alpha-ketoglutarate (100 mg or 147 mg respectively). Results shown are typical of the response seen by CWNIRS in animals treated with cyanide and glyoxylate.

Direct metabolites of glyoxylate do not rescue with comparable efficacy. (A) Metabolite profiling was performed on serial plasma samples collected from rabbits at baseline, during cyanide exposure, and subsequent to i.m. administration of glyoxylate. The pharmacokinetic profile of exogenous glyoxylate is depicted in blue. Data are represented as mean fold change from baseline ± SEM, N = 9. (B) Dose-dependent survival of 5 dpf zebrafish embryos treated with metabolites closely related to glyoxylate through multiple metabolic pathways. Oxaloacetate was 100% lethal at the two highest doses. These data points were removed to preserve an accurate dose–response curve. 3 fish per well, N = 3 wells. Data presented as mean ± SEM.

LDH is crucial for glyoxylate metabolism. (A) Schematic of glyoxylate and its reactions relative to the TCA cycle. LDH is required for glyoxylate’s oxidation and conversion of pyruvate to lactate. It can also be used for the reduction of glyoxylate. (B) Survival of 5 dpf zebrafish 20 h after administration of combinations of the LDH inhibitor GSK2837808A, cyanide, and glyoxylate. Data are presented as mean ± SEM (****p < 0.0001 using one-way ANOVA). There was no significant difference between the untreated control and KCN + glyoxylate and no significant difference between inhibitor + KCN and KCN alone. Each condition had 3 fish per well, N = 3 wells for inhibitor alone, N = 8 for untreated control, N = 7 for KCN alone, N = 4 for KCN + glyoxylate, N = 8 for KCN + glyoxylate + inhibitor, N = 28 for KCN + inhibitor.

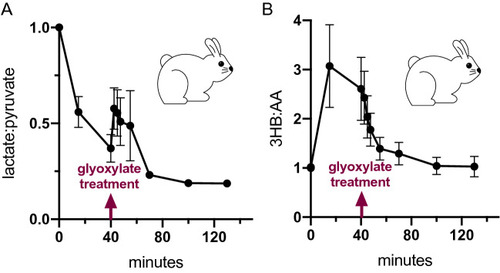
Glyoxylate reverses compartmentalized redox imbalance. (A) The ratio of lactate:pyruvate, a surrogate for the ratio of cytosolic NADH to NAD+ and (B) the ratio of 3-hydroxybutyrate (3HB) to acetoacetate (AA), a surrogate for the ratio of mitochondrial NADH to NAD+, in serial plasma samples collected from rabbits exposed to a 40 min cyanide infusion followed by i.m. glyoxylate treatment. Data are presented as mean ± SEM, N = 9.

Acknowledgments
This image is the copyrighted work of the attributed author or publisher, and ZFIN has permission only to display this image to its users. Additional permissions should be obtained from the applicable author or publisher of the image. Full text @ Sci. Rep.