
- Title
-
Double-Sided Nano-ZnO: Superior Antibacterial Properties and Induced Hepatotoxicity in Zebrafish Embryos
- Authors
- He, M., Li, X., Yu, L., Deng, S., Gu, N., Li, L., Jia, J., Li, B.
- Source
- Full text @ Toxics
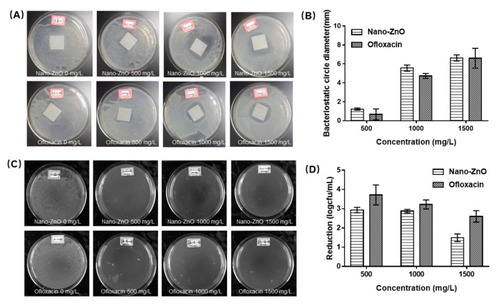
Figure 1. Antibacterial effect of Nano-ZnO on S. aureus: (A) inhibition circle of Nano-ZnO and ofloxacin, (B) quantitative column chart of (A), (C) single colony formation of Nano-ZnO and ofloxacin, (D) quantitative column chart of (C).
|

Figure 2. Effect of Nano-ZnO on the inflammatory response induced by S. aureus. Changes in mRNA levels of antioxidant signaling pathway (A) nrf2-a, (B) nrf2-b, (C) nqo1, and inflammatory signaling pathway (D) nf-kb, (E) tnf-a, (F) il-6, and (G) il-1b. (Control1: no treatment, Control2: wound + sterile water, S. aureus: wound + S. aureus, Nano-ZnO: wound + S. aureus + Nano-ZnO, n = 30, * p < 0.05, **** p < 0.0001).
|

Figure 3. The effect of nano zinc oxide on (A) the survival rate, (B) the hatching rate, (C) the malformation rate, and (D) the swim bladder formation rate. Data are expressed as means ± SD. (n = 30, * p < 0.05, ** p < 0.01, **** p < 0.0001).
|
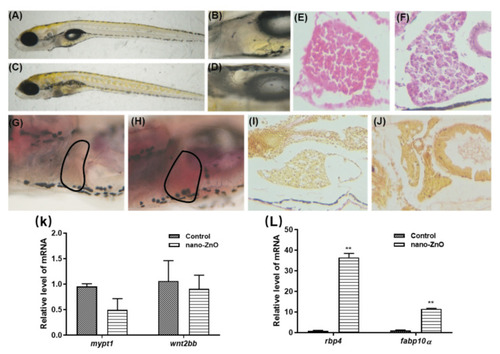
Figure 4. Hepatotoxic effects of 125 nmol/mL Nano-ZnO on zebrafish. Live observation of zebrafish liver differences between the control group and the Nano-ZnO treatment group: (A) control group (250×), (B) control group (410×), (C) Nano-ZnO treatment group (250×), (D) Nano-ZnO treatment group (410×). H&E staining of zebrafish liver: (E) control group (410×), (F) Nano-ZnO treatment group (410×). Oil red staining of zebrafish liver steatosis: (G) control group (410×), (H) Nano-ZnO treatment group (410×). Picric acid-Sirius scarlet staining of zebrafish liver steatosis: (I) control group (410×), (J) Nano-ZnO treatment group (410×). (K) Liver development-related genes relative level of mRNA. (L) Liver disease-related genes relative level of mRNA ** p < 0.01.
|

Figure 5. Effect of 125 nmol/mL Nano-ZnO on apoptosis in zebrafish. Changes in mRNA level of pro-apoptosis genes (A) bid and (B) bax, and anti-apoptosis genes (C) bcl-2 and (D) mcl-1b. (E) Acridine orange apoptosis staining. (n = 30, ** p < 0.01).
|

Figure 6. Mechanism of liver injury caused by 125 nmol/mL Nano-ZnO. (A) Relative levels of ROS; changes in mRNA levels of antioxidant signaling pathways (B) nrf2-a, (C) nrf2-b, (D) gstp1, and (E) nqo1; changes in mRNA levels of ER stress-related genes (F) elf2a and (G) bip. (H) Changes in mRNA levels of the lipid metabolism-related genes acc1, fasn, strebp-1 and strebp-2. (n = 30, * p < 0.05, ** p < 0.01, **** p < 0.0001).
|
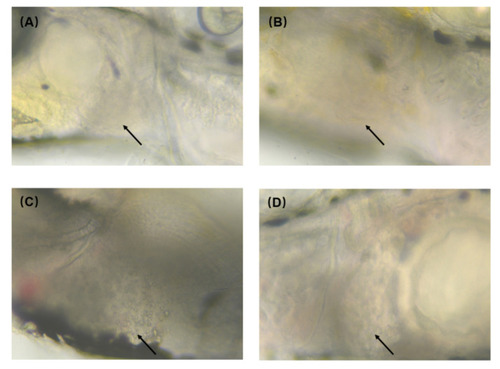
Figure 7. Alleviation of 125 nmol/mL Nano-ZnO toxicity by CDs: (A) control group, (B) CDs group, (C) Nano-ZnO group, (D) CDs + Nano-ZnO group. The arrow sites are zebrafish liver. (A,B,D) are normal zebrafish liver. (C) has obvious lipid droplets.
|