
- Title
-
Benchtop X-band electron paramagnetic resonance detection of melanin and Nitroxyl spin probe in zebrafish
- Authors
- Makarova, K., Zawada, K., Wiweger, M.
- Source
- Full text @ Free Radic. Biol. Med.

Fig. 1. EPR signal from 3 dpf embryos placed in 100 μL standard capillaries and recorded at X-band benchtop EPR (Magnettech): A. signal from 9 larvae, 20dB/MA-100μT/ST-20s/4scans amplitude modulation, and B. signal from 20 larvae with 15dB/MA-500μT/ST-11s/16sc. Arrow (↓) marks the peak corresponding to eumelanin; an asterisk (*) indicates impurities from glass. |

Fig. 2. EPR signal from 1 μM aqueous solution of 3-CP probe in standard 100 μL glass capillary, recorded at X-band benchtop EPR spectrometer. a) signal recorded with standard benchtop, 15dB/MA-100μT/ST-20s/16sc b) signal obtained with a use of eSpect+ 15dB/MA-500μT/ST-11s/16sc. The signal from glass impurities is marked with an asterisk (*), signals from 3-CP probe are marked with arrows. |
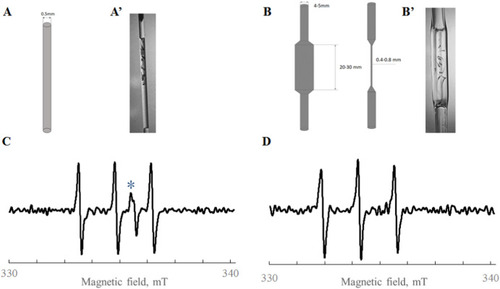
Fig. 3. Newly designed specially-shaped capillaries improve the detection of free radicals in living zebrafish embryos. Schematic view of the capillaries (A, B) and photograph (A′, B′) of a standard 100 μL hematocrit capillary (A, A′) and the prototype of the specially-shaped capillary (B, B′). Cw-EPR signal from 10 μM 3-CP probe recorded with eSpect+: C. standard 100 μL capillary, signal-to-noise = 23, and D. specially-shaped flat capillary, signal-to-noise = 18. The signal form glass impurities is marked with an asterisk (*). EPR parameters were 20dB/MA-500μT/ST-11s/16sc. |

Fig. 4. Detection of the eumelanin in zebrafish embryos loaded into the specially-shaped glass capillary made from 4 mm tubes. EPR parameters were modulation amplitude 500 μT, 16 scans, 25 dB, 11s sweet time. Tap panel - integrated CW X-band EPR with eSpect+ signal from melanin radical originating from 40 zebrafish larvae. Lower panel - representative bright-field images of 3 days old zebrafish larvae: a) untreated wild-type (WT), b) untreated albino, c) WT treated with 3 ppm PTU, and d) WT treated with 6 ppm PTU. Ventral views of the zebrafish head. Scale bar = 0,5 mm. Standard derivative CW X -band spectra are presented as supplementary materials, Fig. S9. |

Fig. 5. CW X band EPR signal from 0.05 mM 5-DSA from 5-DSA incorporated into fish membranes: (a) in the presence of DMSO, which modifies the fluidity of the membrane (b) reference system. EPR parameters: 25dB/MA-500μT/ST-11s/16sc. |
Reprinted from Free radical biology & medicine, 183, Makarova, K., Zawada, K., Wiweger, M., Benchtop X-band electron paramagnetic resonance detection of melanin and Nitroxyl spin probe in zebrafish, 69-74, Copyright (2022) with permission from Elsevier. Full text @ Free Radic. Biol. Med.