
- Title
-
The XRN1-regulated RNA helicase activity of YTHDC2 ensures mouse fertility independently of m6A recognition
- Authors
- Li, L., Krasnykov, K., Homolka, D., Gos, P., Mendel, M., Fish, R.J., Pandey, R.R., Pillai, R.S.
- Source
- Full text @ Mol. Cell
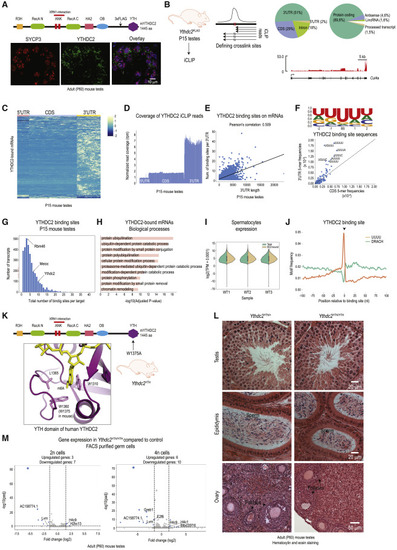
Figure 1. YTHDC2 binds to the 3′ UTR of protein-coding genes through a U-rich motif (A) Cartoon showing domain organization of mouse YTHDC2 protein. The 3xFLAG tag sequence was inserted in the mouse Ythdc2 gene locus between the OB-fold and the YTH domain. Immunofluorescence detection with anti-FLAG (green) and anti-SYCP3 (red) antibodies in adult (P60) testes sections of the Ythdc2FLAG knockin mice. Scale bar in μm is indicated. (B) Testes from Ythdc2FLAG mice (P15) were used to perform iCLIP experiment to identify the YTHDC2-bound RNAs. Binding sites were identified as loci having a pile-up of reads with 3′ ends terminating at the potential crosslinking site or by reads crossing it but having an increased rate of indels. Pie charts showing proportion of YTHDC2 binding sites in different RNA biotypes, and the location of the YTHDC2 binding sites over different RNA features. The coverage of iCLIP reads over a representative target is shown. Notice the enrichment on the 3′ UTR. (C) Heatmap showing z-scores of the iCLIP read coverage per binned YTHDC2-bound transcripts. See also Table S2. (D) Metaplot showing an average iCLIP read coverage over YTHDC2 target transcripts. (E) Scatterplot and the correlation analysis of the number of YTHDC2 binding sites against 3′ UTR length. (F) Sequence logo showing a U-rich motif centered on the YTHDC2 binding site (BS) in a 5-mer window. Scatterplot comparing the 3′ UTRs and CDS frequency of all the pentamers centered on the YTHDC2 crosslink site (mostly a uridine). Top seven 5-mers found at the crosslink site are highlighted. See also Figure S1G. (G) Histogram showing a distribution of the total number of binding sites per transcript. (H) Gene ontology analysis of YTHDC2 targets. Only terms with the adjusted p value < 0.5 were plotted. (I) Violin plots showing the distribution of expression counts (TPM + 0.0001) of all genes (green) in spermatocytes from P15 wild-type mouse testes, next to the distribution of expression counts (TPM + 0.0001) of YTHDC2 targets (orange). Three biological replicates are shown. Although transcripts bound by YTHDC2 have a broad expression profile, they show a slightly higher expression. (J) Distribution of putative m6A methylation sites (DRACH) and a U-rich sequence (UUUU) in a 200-nt window flanking the YTHDC2 binding site (position 0). See also Figures S1E and S1F. (K) A modeled m6A nucleotide in the hydrophobic pocket of the YTH domain of human YTHDC2 from (Wojtas et al., 2017). Key residues required for m6A recognition are indicated. Mutation of W1360 is shown to abolish m6A binding. The corresponding W1375 in the Ythdc2YTH was mutated to assess physiological relevance of the YTH domain in vivo. See also Figure S1H. (L) Eosin and hematoxylin-stained adult testis and ovary sections from heterozygous and homozygous Ythdc2YTH knockin mutant mice. No difference was observed. Scale bar in μm is indicated. (M) Ribo-depleted RNA-seq (in biological triplicates) analysis of FACS-purified 2n (spermatogonia) and 4n (spermatocytes) cells from mouse testes of heterozygous and homozygous Ythdc2YTH knockin mutant mice. Volcano plots show the differential gene expression between the genotypes. Genes showing significant differential expression (padj < 0.05 and log2FC > 1.5 or log2FC < −1.5) are marked in blue. Significantly dysregulated pseudogenes are masked. |
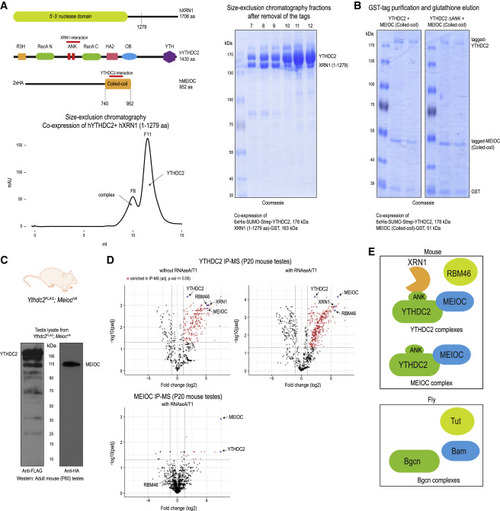
Figure 2. YTHDC2 directly interacts with XRN1 and MEIOC, and associates with RBM46 (A) Cartoon showing domain organization of human YTHDC2, XRN1 and MEIOC. The interaction regions in the proteins are marked. Size-exclusion chromatography protein elution trace showing the presence of YTHDC2-XRN1(1-1279 aa) complex and free YTHDC2 protein. Indicated fractions were analyzed by SDS-PAGE to reveal presence of YTHDC2- XRN1(1-1279 aa) complex (fractions 7-9) and free YTHDC2 (fractions 10–12). See also Figure S2A. (B) Co-expression YTHDC2 and MEIOC-coiled-coil (CC) domain in insect cells as tagged proteins, followed by purification over glutathione-Sepharose beads to isolate MEIOC-CC. SDS-PAGE analysis shows the co-purification of YTHDC2 with MEIOC-CC (left panel). Deletion of the ANK repeats of YTHDC2 does not affect this association (right panel). (C) Western blot of testicular lysate showing expression of YTHDC2-3xFLAG and 2xHA-MEIOC from double-knockin Ythdc2FLAG;MeiocHA mice. (D) Purification of protein complexes using anti-FLAG or anti-HA affinity beads. Complexes were treated with RNases (RNase A/T1), when indicated. Mass spectrometry identification of complex components is shown. The volcano plot shows the enrichment of proteins in purifications from knockin mouse testes lysates compared to that from wildtype mouse testes. See also Table S3. (E) Cartoon showing the different protein associations of mouse YTHDC2 as established in this study in mouse testes. Complex components previously reported to be associating with YTHDC2 fly ortholog Bgcn is also shown. |
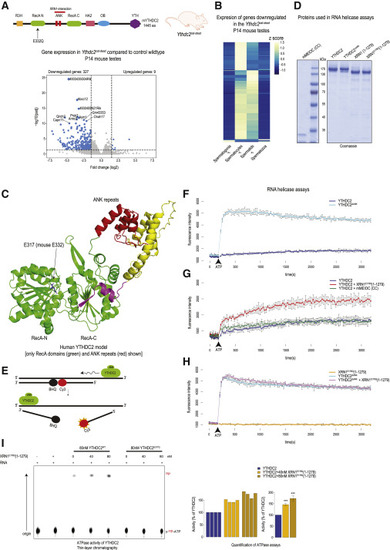
Figure 3. The essential 3′→5′ RNA helicase activity of YTHDC2 is modulated by XRN1 (A) Creation of the RNA helicase catalytic-dead Ythdc2cat-dead mouse mutant with the E332Q mutation in the N-terminal RecA domain. See also Figure S3A. Volcano plot showing differential testicular gene expression analysis between wildtype and Ythdc2cat-dead helicase mutant P14 mice. Significant genes (padj < 0.05 and log2FC > 1.5 or log2FC < −1.5) are shown in blue. (B) Heatmap showing the expression pattern of significantly dysregulated genes (from the Ythdc2cat-dead mutant) in wildtype spermatogenic cell types. Z-scores from TPM counts are plotted. The genes downregulated in the mutant are those normally highly expressed in the spermatocytes and spermatids. (C) Predicted (AlphaFold) structure of human YTHDC2, showing only the two RecA domains and the intervening two ankyrin (ANK) repeats. The helicase catalytic site glutamic acid (E) mutated in the Ythdc2cat-dead mouse mutant is indicated. (D) Coomassie-stained gel (SDS-PAGE) of the recombinant human or mouse (m) proteins used for RNA unwinding assays. (E) Schematic showing fluorescence-based RNA helicase assay. The Cy3 fluorescence is quenched in the duplex state. See also Table S1. (F–I) (F) RNA helicase activity of full-length YTHDC2 and the ΔANK mutant. Deletion of ANK repeats enhances the helicase activity. Error bars refer to SD (G) RNA helicase activity of YTHDC2 in the presence of XRN1E178Q (1-1279) or mouse MEIOC-CC domain. The addition of XRN1E178Q (1-1279) enhances YTHDC2 helicase activity (red line). Error bars refer to SD (H) RNA helicase activity of the YTHDC2 ΔANK mutant is not affected by addition of XRN1E178Q (1-1279). See also Figures S3E and S3F. Error bars refer to SD (I) thin-layer chromatography (TLC) analysis of ATP hydrolysis assays with full-length YTHDC2 or its catalytic-dead version. XRN1E178Q (1-1279) was added in some of the reactions at the indicated concentrations. RNA is needed to stimulate the activity of YTHDC2. See also Figure S3I. Bar plots show the quantified YTHDC2 ATPase activity from four independent experiments. Addition of XRN1E178Q (1-1279) enhances the ATPase activity of YTHDC2. Error bars refer to SD. The one tailed t test was used to test whether activity is higher than 100% (∗∗∗p value < 0.001). |

Figure 4. Loss of mouse Ythdc2 results in germ cells with a mixed mitotic/meiotic identity (A) Single-cell purification of 4n germ cells from mouse testes of Ythdc2+/− and Ythdc2−/− (KO) P10 animals. (B) UMAP-based integrated single-cell map of Ythdc2+/− and Ythdc2−/− (KO) testicular 4n germ cells (left). Annotated cell types are assigned a specific color. Genotype-separated single-cell maps are shown (right). Notice the presence of two unique cell populations present only in the KO testes. (C) Analysis of the indicated mitotic and meiotic marker genes expression. UMAP-based single-cell maps are ordered based on the developmental trajectory: mitotic spermatogonia (SG) marker expression (left), differentiating SG cell marker expression (middle), and leptotene/zygotene meiotic markers expression (right). Note that differentiating SG and meiotic markers are simultaneously expressed in the two populations of cells found exclusively in the Ythdc2 KO. See also Figures S4B and S4C. (D) Model showing how YTHDC2 acts during the mitotic-meiotic transition. In the absence of Ythdc2, germ cells display a mixed identity with expression of markers present in both differentiating SG and meiotic cells. |
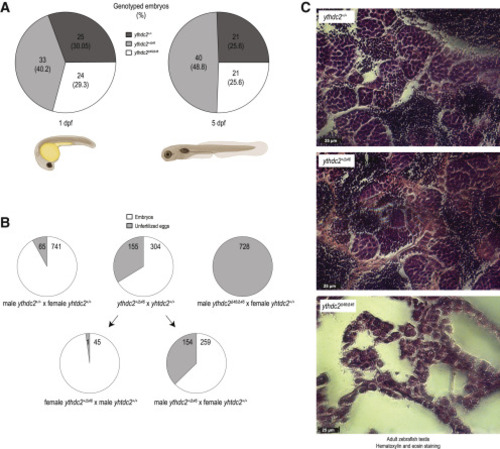
Figure 5. Conserved role of zebrafish ythdc2 in male fertility (A) Generation of ythdc2 knockout (Δ46) zebrafish. Heterozygous crosses give rise to animals in the expected Mendelian ratios. (B) Crosses of heterozygous and homozygous ythdc2Δ46/Δ46 knockout males or females with wildtype partners. Crosses with homozygous knockout males do not produce any embryos, indicating that they are infertile. See also Figure S5B. (C) Hematoxylin and Eosin staining of adult zebrafish testes showing that the infertile homozygous ythdc2Δ46/Δ46 fish lack sperm. Scale bar in μm is indicated. PHENOTYPE:
|

ZFIN is incorporating published figure images and captions as part of an ongoing project. Figures from some publications have not yet been curated, or are not available for display because of copyright restrictions. PHENOTYPE:
|