FIGURE SUMMARY
Title

Oxytocin receptors influence the development and maintenance of social behavior in zebrafish (Danio rerio)

Authors
Gemmer, A., Mirkes, K., Anneser, L., Eilers, T., Kibat, C., Mathuru, A., Ryu, S., Schuman, E.
Source
Full text @ Sci. Rep.

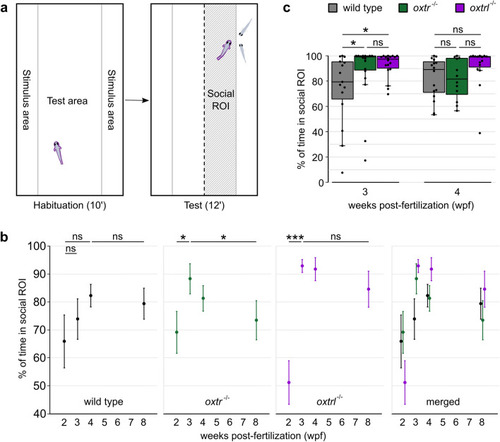
Oxytocin receptors affect the development, intensity and maintenance of social preference. (a) The behavioral chamber for social preference tests was composed of one test area and two stimulus areas, divided by transparent walls. After a habituation period, two stimulus fish were added to one stimulus area and the half next to the stimulus fish was defined as “social ROI” during analysis. (b) Social preference developed faster in both the oxtr−/− and oxtrl−/− fish and in oxtr−/− fish the maintenance of social preference was impaired. Values are reported as mean ± standard error of the mean (s.e.m.). Asterisks represent the statistical comparison of age in the different genotypes. n(social wildtype, 2 wpf) = 15, n(social wildtype, 3 wpf) = 15, n(social wildtype, 4 wpf) = 16, n(social wildtype, 8 wpf) = 13, n(social oxtr−/−, 2 wpf) = 15, n(social oxtr−/−, 3 wpf) = 18, n(social oxtr−/−, 4 wpf) = 12, n(social oxtr−/−, 8 wpf) = 16, n(social oxtrl−/−, 2 wpf) = 18, n(social oxtrl−/−, 3 wpf) = 18, n(social oxtrl−/−, 4 wpf) = 15, n(social oxtrl−/−, 8 wpf) = 11. Kruskal–Wallis-Test: p(social wildtype) = 9.31 × 10−1, p(social oxtr−/−) = 1.65 × 10−2, p(social oxtrl−/−) = 4.09 × 10−5. Post-hoc Wilcoxon rank-sum test for socially reared oxtr−/−: p(2wpf⇔3wpf) = 3.66 × 10−2, p(2wpf⇔4wpf) = 6.11 × 10−1, p(2wpf⇔8wpf) = 6.42 × 10−1, p(3wpf⇔4wpf) = 7.40 × 10−2, p(3wpf⇔8wpf) = 4.95 × 10−2, p(4wpf⇔8wpf) = 6.42 × 10−1. Post-hoc Wilcoxon rank-sum test for socially reared oxtrl−/−: p(2wpf⇔3wpf) = 2.09 × 10−4, p(2wpf⇔4wpf) = 3.54 × 10−4, p(2wpf⇔8wpf) = 7.20 × 10−3, p(3wpf⇔4wpf) = 9.86 × 10−1, p(3wpf⇔8wpf) = 9.86 × 10−1, p(4wpf⇔8wpf) = 9.86 × 10−1. (c) At 3 and 4 wpf, the level of social preference was increased in the oxtrl−/− fish. Fish of the oxtr−/− line also showed enhanced social preference at 3 wpf, but did not maintain this high level at 4 wpf. Each dot represents one experimental fish. Asterisks represent the statistical comparison of genotype in two age groups. n(social wildtype, 3 wpf) = 15, n(social oxtr−/−, 3 wpf) = 18, n(social oxtrl−/−, 3 wpf) = 18, n(social wildtype, 4 wpf) = 16, n(social oxtr−/−, 4 wpf) = 12, n(social oxtrl−/−, 4 wpf) = 15. Kruskal–Wallis-Test: p(social 2 wpf) = 2.25 × 10−1, p(social 3 wpf) = 2.35 × 10−2, p(social 4 wpf) = 3.61 × 10−2, p(social 8 wpf) = 2.87 × 10−1. Post-hoc Wilcoxon rank-sum test for socially reared 3 wpf: p(wt⇔oxtr−/−) = 2.93 × 10−2, p(wt⇔oxtrl−/−) = 2.93 × 10−2, p(oxtr−/−⇔oxtrl−/−) = 7.00 × 10−1. Post-hoc Wilcoxon rank-sum test for socially reared 4 wpf: p(wt⇔oxtr−/−) = 9.26 × 10−1, p(wt⇔oxtrl−/−) = 5.34 × 10−2, p(oxtr−/−⇔oxtrl−/−) = 5.34 × 10−2. Number of replicates (n) and excluded n can be found in Supplementary Table S1, significance values in Supplementary Table S2. Significance is reported as *p < 0.05, **p < 0.01, ***p < 0.001.

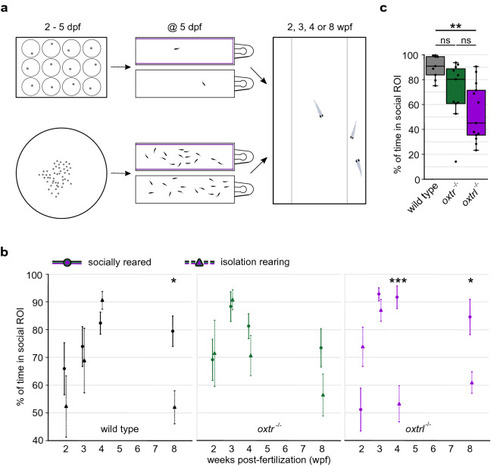
Isolation rearing impairs the maintenance, but not the development of social preference. (a) Rearing conditions: Experimental fish were raised in isolation (2–5 days post-fertilization (dpf) in 12-well plates, from 5 dpf until experiment in 1.1L tanks with visual barriers (here shown in purple) in every second tank) or with conspecifics (2–5 dpf in a dish with 145 mm diameter, from 5 dpf until experiment in 1.1L tanks with visual barriers in every second tank at densities of 10–15 fish/L). The social preference test was performed at 2, 3, 4 or 8 wpf. (b) The development of social preference was not influenced by isolation rearing. Similar to the phenotype observed for socially reared fish, knocking-out one of the Oxytocin receptors led to an accelerated development of social preference in isolated fish. Isolation rearing impaired the maintenance of social preference, but 4 wpf old oxtr−/− fish were less susceptible to isolation. Values are reported as mean ± standard error of the mean (s.e.m.). Asterisks represent the statistical comparison of rearing conditions (social vs. isolation) in different age groups of each genotype. Data for socially reared fish are also presented in Fig. 1b. n(isolated wildtype, 2 wpf) = 11, n(isolated wildtype, 3 wpf) = 11, n(isolated wildtype, 4 wpf) = 9, n(isolated wildtype, 8 wpf) = 16, n(isolated oxtr−/−, 2 wpf) = 9, n(isolated oxtr−/−, 3 wpf) = 18, n(isolated oxtr−/−, 4 wpf) = 11, n(isolated oxtr−/−, 8 wpf) = 10, n(isolated oxtrl−/−, 2 wpf) = 13, n(isolated oxtrl−/−, 3 wpf) = 12, n(isolated oxtrl−/−, 4 wpf) = 13, n(isolated oxtrl−/−, 8 wpf) = 17. Kruskal–Wallis-Test: p(wildtype) = 6.70 × 10−3, p(oxtr−/−) = 2.00 × 10−4, p(oxtrl−/−) = 7.79 × 10−9, Post-hoc Wilcoxon rank-sum test for social vs. isolation reared wildtype: p(wildtype, 2wpf) = 3.39 × 10−1, p(wildtype, 3wpf) = 9.59 × 10−1, p(wildtype, 4wpf) = 3.39 × 10−1, p(wildtype, 8wpf) = 1.64 × 10−2, Post-hoc Wilcoxon rank-sum test for social vs. isolation reared oxtr−/−: p(oxtr−/−, 2wpf) = 4.09 × 10−1, p(oxtr−/−, 3wpf) = 4.09 × 10−1, p(oxtr−/−, 4wpf) = 4.09 × 10−1, p(oxtr−/−, 8wpf) = 2.76 × 10−1, Post-hoc Wilcoxon rank-sum test for social vs. isolation reared oxtrl−/−: p(oxtrl−/−, 2wpf) = 9.09 × 10−2, p(oxtrl−/−, 3wpf) = 3.50 × 10−1, p(oxtrl−/−, 4wpf) = 3.58 × 10−4, p(oxtrl−/−, 8wpf) = 1.46 × 10−2. (c) oxtr−/− and oxtrl−/− fish showed decreased social preference at 4 wpf after isolation rearing. Each dot represents one experimental fish. Asterisks represent the statistical comparison of genotype after isolation rearing at 4 wpf. n(isolated wildtype, 4 wpf) = 9, n(isolated oxtr−/−, 4 wpf) = 11, n(isolated oxtrl−/−, 4 wpf) = 13. Kruskal–Wallis-Test: p(isolated 2 wpf) = 1.85 × 10−1, p(isolated 3 wpf) = 3.51 × 10−1, p(isolated 4 wpf) = 1.80 × 10−3, p(isolated 8 wpf) = 4.82 × 10−1. Post-hoc Wilcoxon rank-sum test for isolation-reared 4 wpf: p(wt⇔oxtr−/−) = 5.01 × 10−2, p(wt⇔oxtrl−/−) = 2.52 × 10−3, p(oxtr−/−⇔oxtrl−/−) = 9.29 × 10−2. Number of replicates (n) and excluded n can be found in Supplementary Table S1, significance values in Supplementary Table S2. Significance is reported as *p < 0.05, **p < 0.01, ***p < 0.001.

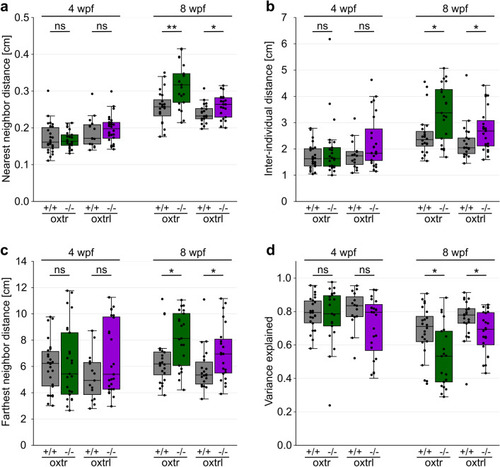
Shoal cohesion and polarization is positively influenced by the Oxytocin receptors at 8 wpf. (a) The absence of either Oxytocin receptor led to increased nearest neighbor distance at 8 wpf, but not at 4 wpf. n for shoals: see below. Kruskal–Wallis-Test for nearest-neighbor distance: p(4wpf) = 1.69 × 10−2, p(8wpf) = 4.72 × 10−5, Wilcoxon rank-sum test for the nearest-neighbor distance of wild-type vs. mutant genotype: p(oxtr+/+⇔oxtr−/−, 4wpf) = 4.74 × 10−1, p(oxtrl+/+⇔oxtrl−/−, 4wpf) = 3.17 × 10−1, p(oxtr+/+⇔oxtr−/−, 8wpf) = 1.64 × 10−3, p(oxtrl +/+⇔oxtrl−/−, 8wpf) = 4.13 × 10−2. (b) The inter-individual distance was enlarged in both Oxytocin receptor KO lines at 8 wpf, but not at 4 wpf. n for shoals: see below. Kruskal–Wallis-Test for inter-individual distance: p(4wpf) = 2.07 × 10−1, p(8wpf) = 2.40 × 10−3, Wilcoxon rank-sum test for the inter-individual distance of wild-type vs. mutant genotype: p(oxtr+/+⇔oxtr−/−, 4wpf) = 4.09 × 10−1, p(oxtrl+/+⇔oxtrl−/−, 4wpf) = 2.59 × 10−1, p(oxtr+/+⇔oxtr−/−, 8wpf) = 1.38 × 10−2, p(oxtrl+/+⇔oxtrl−/−, 8wpf) = 2.01 × 10−2. (c) oxtr−/− and oxtrl−/−showed increased farthest neighbor distance at 8 wpf, but not at 4 wpf. n for shoals: see below. Kruskal–Wallis-Test for farthest-neighbor distance: p(4wpf) = 4.79 × 10−1, p(8wpf) = 2.65 × 10−3, Wilcoxon rank-sum test for the farthest-neighbor distance of wild-type vs. mutant genotype: p(oxtr+/+⇔oxtr−/−, 4wpf) = 4.74 × 10−1, p(oxtrl+/+⇔oxtrl−/−, 4wpf) = 1.29 × 10−1, p(oxtr+/+⇔oxtr−/−, 8wpf) = 1.91 × 10−2, p(oxtrl+/+⇔oxtrl−/−, 8wpf) = 1.91 × 10−2. (d) Coordinated swimming, represented by the variance explained, was reduced in both knockout groups at 8 wpf but remained unaffected at 4 wpf. n for shoals: see below. Kruskal–Wallis-Test for variance explained: p(4wpf) = 5.64 × 10−1, p(8wpf) = 7.00 × 10−4, Wilcoxon rank-sum test for the variance explained of wild-type vs. mutant genotype: p(oxtr+/+⇔oxtr−/−, 4wpf) = 8.88 × 10−1, p(oxtrl+/+⇔oxtrl−/−, 4wpf) = 4.80 × 10−1, p(oxtr+/+⇔oxtr−/−, 8wpf) = 4.95 × 10−2, p(oxtrl+/+⇔oxtrl−/−, 8wpf) = 4.95 × 10−2. Number of shoals (containing 20 fish each) per group: n(oxtr+/+, 4wpf) = 26, n(oxtr−/−, 4wpf) = 25, n(oxtrl+/+, 4wpf) = 15, n(oxtrl−/−, 4wpf) = 28, n(oxtr+/+, 8wpf) = 24, n(oxtr−/−, 8wpf) = 21, n(oxtrl+/+, 8wpf) = 22, n(oxtrl−/−, 8wpf) = 23. Each dot represents one shoal. Asterisks represent the statistical comparison between mutant and wild-type genotype at different ages. Number of replicates (n) and excluded n can be found in Supplementary Table S1, significance values in Supplementary Table S2. Significance is reported as *p < 0.05, **p < 0.01, ***p < 0.001.

Acknowledgments
This image is the copyrighted work of the attributed author or publisher, and ZFIN has permission only to display this image to its users. Additional permissions should be obtained from the applicable author or publisher of the image. Full text @ Sci. Rep.