
- Title
-
Systematic developmental toxicity assessment of a structurally diverse library of PFAS in zebrafish
- Authors
- Truong, L., Rericha, Y., Thunga, P., Marvel, S., Wallis, D., Simonich, M.T., Field, J.A., Cao, D., Reif, D.M., Tanguay, R.L.
- Source
- Full text @ J. Hazard. Mater.
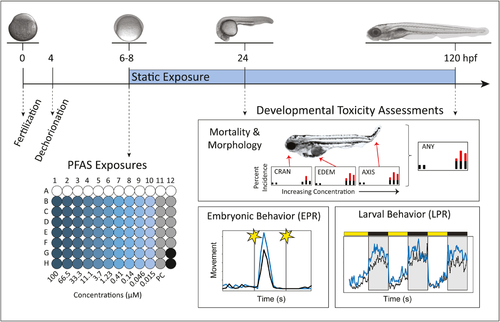
Overall Experimental Design.
Embryonic zebrafish were developmentally exposed from 6 to 120 hpf (top; hpf = hours post-fertilization). The embryos were exposed to 10 concentrations of PFAS (plate design: all shades of blue), 4 concentrations of PC (parathion ethyl positive control; gray), and vehicle control (white). At 24 and 120 hpf, embryos were assessed for mortality and 10 morphological endpoints and a summary endpoint (ANY). Examples are: CRAN = craniofacial malformations, EDEM = edema, AXIS = bent axis. Embryonic and Larval Photomotor Response are behavior assays in which movement was assessed in response to 2 flashes of light or alternating light/dark cycles at 24 and 120 hpf. |

Developmental toxicity screening using the embryonic zebrafish model.
A. Summary of Developmental Toxicity Bioactivity. Dots are colored by their activity (hypo vs hyper), their size represents Point Of Departure (POD) estimate (larger = higher POD), and transparency levels represent the potency (darker = more potent). B. Venn Diagram of the number of PFAS that were bioactive in morphology, embryonic photomotor response (EPR), and larval photomotor response (LPR) assays. |

Bar plot showing break -down of chemicals’ bioactivity and volatility across each endpoint tested. Red shaded regions represent the number of volatile compounds in that category and blue shaded regions represent the number of non-volatile compounds in that category. A Fisher’s exact test was applied to the counts of the number of volatile and non-volatile PFAS detected in each assay (p < 0.05). |
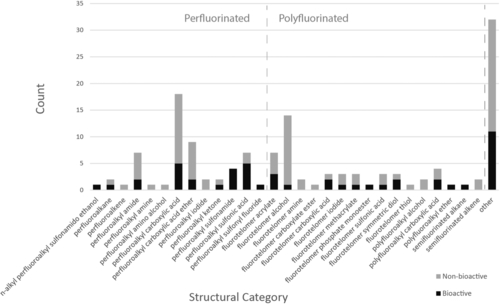
Bar plot showing breakdown of PFAS into structural categories. Within each bar, the black shaded regions represent the number of PFAS that induced at least one hit in any of the assays and gray represents the number that were not a hit. The gray dotted line in the center of the bar plot divides the PFAS into perfluorinated (left) and polyfluorinated (right, except for the other category). |
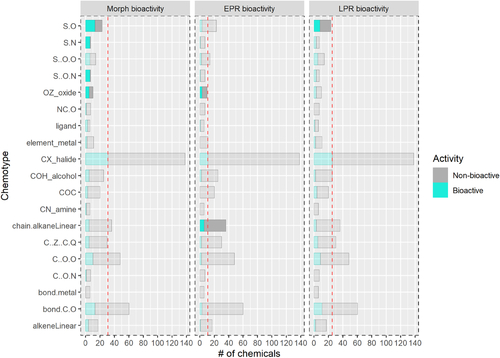
The vertical axis represents 19 broad chemotype-categories obtained by collapsing Toxprint chemotype into 36 super chemotypes. The horizontal axis represents the number of compounds carrying that chemotype. Each rectangular section represents bioactivity in the indicated assay (Morphology, EPR and LPR). Teal fill represents the compounds that carried a certain chemotype and induced bioactivity in a specific, whereas grey indicates compounds that did not induce bioactivity but carried that chemotype. Chemotypes that were statistically enriched (Fisher Exact Test p-value <0.05) among bioactives or non-bioactives are shown in darker shades. The vertical red dotted line indicates the total number of compounds that induced bioactivity within each assay. |
Reprinted from Journal of hazardous materials, 431, Truong, L., Rericha, Y., Thunga, P., Marvel, S., Wallis, D., Simonich, M.T., Field, J.A., Cao, D., Reif, D.M., Tanguay, R.L., Systematic developmental toxicity assessment of a structurally diverse library of PFAS in zebrafish, 128615, Copyright (2022) with permission from Elsevier. Full text @ J. Hazard. Mater.