FIGURE SUMMARY
Title

Oligodendrocyte precursor cells sculpt the visual system by regulating axonal remodeling

Authors
Xiao, Y., Petrucco, L., Hoodless, L.J., Portugues, R., Czopka, T.
Source
Full text @ Nat. Neurosci.

The tectal neuropil of larval zebrafish is interspersed with OPC processes but largely devoid of myelin.

a, Transgenic zebrafish showing OPC processes throughout the brain. Dashed line indicates cross-sectional plane shown in b and c. Schematic of zebrafish brain delineates RGC axons, dendrites of PVINs and OPCs in tectal neuropil. b, c, Cross-sectional views of transgenic zebrafish showing that OPC processes intersperse the tectal neuropil (dashed lines), whereas myelin is largely absent. Scale bars, 50 µm. d, Sub-projection of OPC reporter lines (dorsal view) stained with BODIPY to outline tectal neuropil (NP) and the periventricular neuron zone (PVN). Dashed lines indicate the border between NP and PVN. Scale bar, 40 µm. e, Time lapse of four individual OPCs (lateral rotation view). Dashed lines depict tectal NP. Scale bar, 20 µm. f, g, Quantifications of individual OPCs as shown in e, showing low rates of soma position changes, division and differentiation.

Early OPC depletion causes formation of aberrant RGC arborizations.

a, Time lapse showing dynamic interactions between RGC axon arbors and OPC processes. Dashed box indicates the position of time lapse shown. Arrows indicate when extending RGC process interdigitates with OPC process and subsequently retracts (see Supplementary Video 6 for 3D rotation to demonstrate contact). Pie chart shows frequency of RGC retractions with and without prior OPC contact. Scale bars, 10 µm (top) and 2 µm (bottom). b, Timelines of manipulations in this figure. c, d, Example images of NTR-mediated OPC ablation (c) and olig2 morpholino-mediated OPC depletion. Dashed lines indicate neuropil. Scale bars, 25 µm. e, f, Increased formation of ectopic RGC axon branches extending outside tectal neuropil (arrows) upon early ablation of OPCs (mean 7.5 ± 5.1 s.d. in control versus 22.0 ± 5.3 in OPC NTR ablation, n = 14/15 animals from four experiments, unpaired two-tailed t-test, t = 7.466, d.f. = 27). Dashed lines indicate the border between NP and PVN. Scale bar, 20 µm. g, Increased formation of ectopic RGC axon branches upon genetic OPC reduction (olig2 morphants) but not upon microglial depletion (irf8 morphants) (mean 7.9 ± 4.3 s.d. in control versus 16.2 ± 3.9 in olig2 MO versus 9.7 ± 4.6 in irf8 MO, n = 21/25/20 animals from three experiments, one-way ANOVA, F2,63 = 23.69). h, i, Increased size of single RGC arbors upon early OPC ablation (top) while maintaining single lamina layering (bottom) (median 287 ± 403/235 IQR in control versus 393 ± 461/286 in OPC NTR ablation, n = 26/27 axons in 24/23 animals from three experiments, two-tailed Mann–Whitney U-test, U = 210). Scale bars, 10 µm. j, Increased size of single RGC arbors upon genetic OPC depletion (olig2 morphants) but not upon microglial depletion (irf8 morphants) (median 304 ± 391/255 IQR in control versus 355 ± 458/326 in olig2 MO versus 285 ± 323/229 in irf8 MO, n = 21/30/16 axons in 11/14/12 animals from five experiments, Kruskal–Wallis test, test statistic = 9.9). MO, morphant.

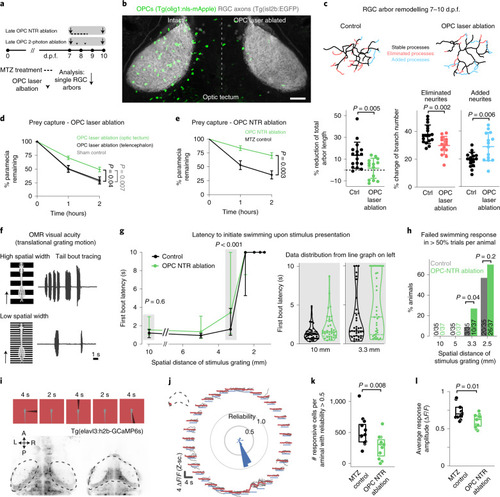
Late OPC ablation impairs RGC arbor remodeling and circuit function.

a, Timelines of manipulations for late OPC ablations. b, Examples showing unilateral laser ablation of OPCs in the tectum. Scale bar, 20 µm. c, Reconstructions of time-projected RGC arbors highlighting stable, eliminated and added processes. Quantifications show diminished developmental reduction of RGC arbors between 7 d.p.f. and 10 d.p.f in OPC-ablated animals (left graph), mediated by decreased branch eliminations (middle) and enhanced additions (right) (left: mean 13.6 ± 12.1 s.d. in control versus 1.7 ± 9.2 in OPC laser ablation; middle: 37.9 ± 6.7 versus 29.9 ± 6.6; right: 19.5 ± 5.2 versus 28.8 ± 10.2; n = 17/14 cells in 11/9 animals from four experiments, unpaired two-tailed t-test, left: t = 3.022, d.f. = 29; middle: t = 3.372, d.f. = 29; right: t = 3.089, d.f. = 18.44). d, e, Impaired paramecium capture rates upon tectal OPC laser ablation (d) and OPC NTR ablation (e); (d: mean 27.6 ± 4.9 s.e.m. in sham control versus 29.7 ± 6.3 in telencephalic OPC ablation versus 49.2 ± 4.2 in tectal OPC ablation at 2-h time point, n = 11/10/23 animals from four experiments, two-way ANOVA, F4,123 = 3.369); (e: mean 35.2 ± 7.3 s.e.m. in MTZ control versus 70.2 ± 5.1 in OPC NTR ablation at 2-h time point, n = 18 animals per group from four experiments, two-way ANOVA, F2,102 = 6.759). f, Experimental setup of OMR elicited by moving gratings of different spatial widths and example trace of tail bout recording. g, First bout latencies in OMR assays. Violin plots show distribution of individual data points at 10 mm and 3.3 mm spatial frequency (10 mm: median 1.2 ± 1.6/0.7 IQR in control versus 1.5 ± 2.9/1.0 in OPC NTR ablation; 3.3 mm: median 1.6 ± 3.9/0.9 in control versus 3.4 ± 9.9/1.1 in OPC NTR ablation; n = 35/37 animals from six experiments, two-way ANOVA, F6,490 = 1.853). h, Enhanced possibility of failure to initiate swimming in response to narrow moving gratings upon OPC NTR ablation (one-tailed Fisher’s exact test). i, Top, visual stimulation protocol for analyzing responses of tectal neurons. Bottom, example anatomies obtained from calcium imaging in two different planes. Dashed lines indicate optic tectum. j, Visual responses from an example neuron. Each plot reports individual (black) and average (red) responses; plot position indicates position of the stimulus (top is frontal). Polar histogram represents the reliability score for this neuron to each stimulus position. k, Decreased number of reliably responsive neurons in OPC-ablated animals (median 457 ± 351/633 IQR in control versus 307 ± 123/386 in OPC NTR ablation, two-tailed Mann–Whitney U-test, U = 2.6465, n = 12/11 animals from three experiments). l, Decreased response amplitudes in OPC-ablated animals (median 0.700 ± 0.658/0.791 IQR in control versus 0.624 ± 0.536/0.672 in OPC NTR ablation, two-tailed Mann–Whitney U-test, U = 2.4618, n = 12/11 animals from three experiments).

Acknowledgments
This image is the copyrighted work of the attributed author or publisher, and ZFIN has permission only to display this image to its users. Additional permissions should be obtained from the applicable author or publisher of the image. Full text @ Nat. Neurosci.