FIGURE SUMMARY
Title

Chloride intracellular channel 1 activity is not required for glioblastoma development but its inhibition dictates glioma stem cell responsivity to novel biguanide derivatives

Authors
Barbieri, F., Bosio, A.G., Pattarozzi, A., Tonelli, M., Bajetto, A., Verduci, I., Cianci, F., Cannavale, G., Palloni, L.M.G., Francesconi, V., Thellung, S., Fiaschi, P., Mazzetti, S., Schenone, S., Balboni, B., Girotto, S., Malatesta, P., Daga, A., Zona, G., Mazzanti, M., Florio, T.
Source
Full text @ J. Exp. Clin. Cancer Res.

A Concentration-response curves of novel biguanide derivatives on GSC viability, in comparison with metformin activity. UPPER LINES (from the left): Chemical structures of linear biguanides (structurally related to metformin) highlighting the biguanide moiety (in red); antiproliferative activity of Q42, Q46, Q48, Q49, and Q50 in comparison with metformin activity. LOWER LINES (from the left): Chemical structures of cyclic biguanides (structurally related to cycloguanil) highlighting the biguanide moiety (in red); antiproliferative activity of Q51, Q52, Q53, and Q54 in comparison with metformin activity. Cell viability was evaluated by MTT assay after 48 h of treatment. Data are reported as average of replica experiments in multiple GSC cultures (mean ± S.E.M. of at least three independent experiments for each culture). Table 1 within the figure reports the number of cultures analyzed for each compound and the calculated potency and efficacy. Compound effect in individual cultures is reported in Fig. S3, and point-by point statistical analysis is reported in Table S3. B Concentration-response curves of novel biguanide derivatives on differentiated (non-GSCs) glioblastoma cell viability, in comparison with metformin activity. Left graph: antiproliferative activity of Q42, Q46, Q48, Q49, and Q50 in comparison with metformin activity (in red). Right graph: antiproliferative activity of Q51, Q52, Q53, and Q54 in comparison with metformin activity (in red). Cell viability was evaluated by MTT assay after 48 h of treatment. Data are reported as average of replica experiments in multiple differentiated glioblastoma cell cultures (mean ± S.E.M. of at least three independent experiments for each culture), obtained by the same GSC cultures analyzed in A, by shifting culture conditions in FBS containing medium. Compound effect in individual cultures is reported in in Fig. S4, and point-by point statistical analysis is reported in Table S4. C Concentration-response curves of novel biguanide derivatives on umbilical cord mesenchymal stem cell (ucMSC) viability, in comparison with metformin activity. Left graph: antiproliferative activity of Q42, Q46, Q48, Q49, and Q50 in comparison with metformin activity (in red). Right graph: antiproliferative activity of Q51, Q52, Q53, and Q54 in comparison with metformin activity (in red). Cell viability was evaluated by MTT assay after 48 h of treatment. Data are reported as average of replica experiments in independently isolated ucMSC cultures (mean ± S.E.M. of at least three independent experiments for each culture). Compound effect in individual cultures is reported in in Fig. S5, and point-by point statistical analysis is reported in Table S5

A Antiproliferative activity of Q48, Q54, and Q46 biguanide derivatives in GSCs, evaluated by live cell counting. Cell proliferation of GBM3, 19 and 23, treated with Q48, Q54 and Q46 at 10 and 100 μM concentrations was evaluated counting live cells by Trypan-blue exclusion, 48-72 h post-treatment. Data represent the mean ± S.E.M. of 3 independent experiments performed in quadruplicate. Direct cell counting confirmed the high efficacy and potency of Q48 and Q54. Q46, used as negative control, was ineffective. *p < 0.05, **p < 0.01, ***p < 0.001 vs. respective control (CTR). B Effect of novel biguanide derivatives on CLIC1-mediated ion current in GSCs. CLIC1-mediated ion current was evaluated by whole cell patch clamp electrophysiology measurement in voltage-clamp configuration in GBM3. Cell were sequentially perfused with vehicle (controls), Q46 (0.5–1 mM), Q48 (0.1–0.5 mM), Q54 (0.1–0.5 mM) and metformin (1–10 mM), followed by IAA94 (100 μM) to identify CLIC1 residual activity, in current time-course experiments. Box chart plots report the mean current inhibition as ratio of the biguanide and IAA94 sensitive currents. IAA94 treatment represents the residual CLIC1 activity. Grey dots, next to box charts, indicate the number of cells used for the statistics (range 4–8) for each drug concentration. *p < 0.05, **p < 0.01, ***p < 0.001 vs. respective control cells. C Microscale Thermophoresis (MST) analysis of CLIC1 binding by novel biguanide compounds. MST analysis of Q48 (left) and Q54 (right) binding to CLIC1. Titration curve of RED-NHS-labelled CLIC1 (10 nM) with increasing concentrations of novel compounds. MST data are the average of three replicates. The sigmoidal fitting curve, obtained using GraphPad Prism 5.0 software, is shown in red

A Effect of novel biguanide derivatives on GSC sphere formation ability. Sphere-formation assay was performed on GBM3 GSCs, treated with Q48, Q54, and Q46 (10–100 μM) or metformin (1-10 mM) for 7 days, and analyzed by microscopic assessment and imaging. Spheres were counted by two independent investigators and the percentage of sphere-forming cells determined for each treatment group (n = 3). Representative phase contrast microscopic images of serum-free suspension depicting number and size of spheres in control (CTR) and Q48, Q54, and Q46-treated (10 and 100 μM) GBM3 cells. Compounds efficacy is compared to metformin (MET) activity, used at 1 and 10 mM. Bar = 150 μm. Bar graphs report sphere number generated after compound treatments, expressed as the mean percentage ± S.D. of respective CTR. *p < 0.05, **p < 0.01, ***p < 0.001 vs. CTR. B Effect of novel biguanide derivatives on GSC migration. Fluorescently labeled cells from GBM3, 19, and 23 were treated with Q46, Q48 and Q54 (100 μM), metformin (10 mM), or vehicle (CTR). GSCs were plated in fluorescence-blocking membrane transwells, using 10% FBS-containing medium as chemoattractant in the lower wells. Migrated cells reaching the bottom surface of the membrane were photographed by confocal microscopy and quantified by ImageJ software. Left panels: Representative confocal microscopy images of migrated cells on the surface of the permeable support. Bar = 100 μm. Right panels: Quantification of migrated cells using ImageJ. Data represent the mean ± S.D. (n = 3). **p < 0.01, ***p < 0.001 vs. CTR. C Effect of novel biguanide derivatives on GSC Matrigel invasion. GBM3, 23 and 19 newly formed spheres were embedded in Matrigel and treated with Q48 (100 μM), Q54 (100 μM), Q46 (100 μM) and metformin (10 mM). The invasion rate was evaluated after 15 h, using the ImageJ software, measuring at least 2 diameters for each sphere. The differences between the average diameter of T15 and T0 of each condition were calculated and compared to control. Upper panels: Representative GBM3 images of individual sphere embedded in Matrigel at T0 and after 15 h of treatment (magnification: 10x). Lower panels: Bar graphs represent the mean ± S.E.M (n = 25), expressed as percentage of respective controls (CTR) of cell invasion. ∗p < 0.05, ∗∗p < 0.01, ∗∗∗p < 0.001 vs. respective CTR

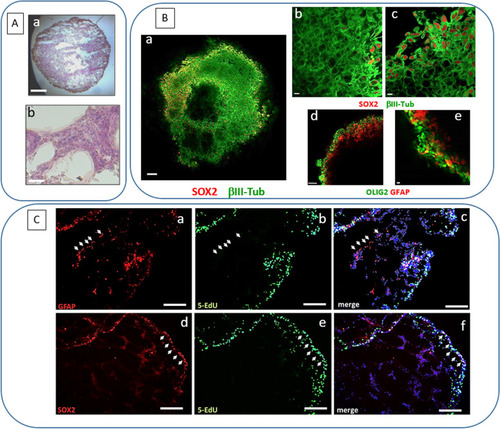
Characterization of GSC 3D organoids. A Hematoxylin & eosin staining of GSC organoid sections, after 3 weeks of cultures: cells are organized in a tissue-like layered structure. a: bar = 500 μm; b: bar = 50 μm. B Immunofluorescence images of the whole GSC organoid structure labelled with Sox2 (red) and β-III tubulin (green) (a: bar = 100 μm; b and c: bar = 10 μm), or Olig2 (green) and GFAP (red) (d: bar = 100 μm; e: bar = 10 μm) obtained by confocal microscopy. Cells expressing stem cell markers, Sox2 and Olig2, display a peripheral localization as compared to differentiated cells expressing β-III tubulin and GFAP. C Immunofluorescent labelling for GFAP (red, upper pictures) and Sox2 (red, lower pictures) performed on slices of GSC organoids after 3 weeks of cultures, incubated with 5-EdU (green), to mark actively proliferating cells. Nuclei are counterstained with DAPI (blue). White arrows highlight that most proliferating cells are Sox2-positive and localized at the periphery of the organoid; conversely, most GFAP-positive cells display an inner localization and are not co-labelled by 5-EdU. Bar = 200 μm

A Q48 and Q54 and metformin, display antiproliferative activity in the GSC organoids. Representative images of organoids at d0 and d7, prior to treatment (upper pictures). After further 7 days of treatment proliferating cells were labelled with 5-EdU (green in the lower pictures). Bar = 100 μm. The quantification of the compound-dependent changes in proliferation rate (reported as % of control values in the graph) was obtained using the ImageJ software. Q48 and Q54 (100 μM) and metformin (10 mM) caused a highly significant reduction of proliferating cells, while Q46 was not effective. ***p < 0.001 vs. CTR. B In vivo antitumor activity of novel biguanides in zebrafish xenotransplanted with GCSs. Left: Representative pictures showing the expansion of the tumor mass at 72 h post injection in zebrafish embryos’ brain injected with ZsGreen-positive cells treated with 1 mM Q54, Q48, and Q46 dissolved in embryos’ water. CTR = controls. Scale bar 100 μm. Right: Quantification of the integrated density of the tumor mass in control condition or in presence of the compounds. Every experimental point represents the expansion of the tumor mass measured in the single embryo’s brain. Data are reported as mean ± SEM; CTR n = 11, Q54 n = 9, Q48 n = 12, Q46 = 14; ***p = 0 .0002. C Biguanide treatment selectively reduce Sox2+ cell content. Left: Western blot depicting Sox2 levels in GBM3 GSCs cultures in control conditions (CTR) or after treatment with with Q48 (100 μM), Q54 and Q46 (300 μM), and metformin (10 mM) for 48 h α-tubulin analysis was used to normalize the results for protein content (upper panel). All the treatments, but Q46, significantly reduced Sox2 expression. Quantification by densitometric analysis normalized for α-tubulin expression, reported as the average of two independent analyses (lower panel). * = p < 0.05; ** = p < 0.01. Right: Representative images of the changes in cell composition within organoids after Q46, Q48, and Q54 treatment evaluated by immunofluorescence, labelling GSCs (Sox2-expressing, red) and differentiated cells (β-III tubulin-expressing, green). Nuclei are counterstained with DAPI (blue). Bar = 200 μm. Q48 and Q54 treatment significantly reduced the number of Sox2-expressing cells (purple for the co-localization of Sox2, red, and nuclei, blue) as compared to vehicle-treated control. Q46 is ineffective

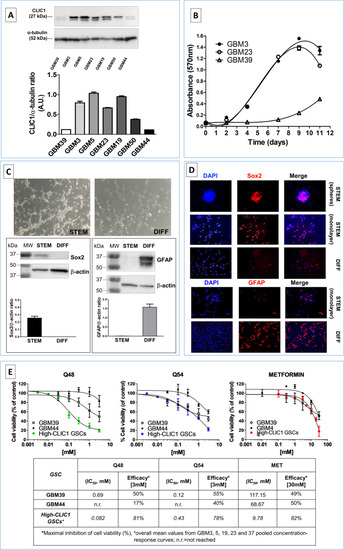
Characterization of GSC cultures expressing low levels of CLIC1 protein. A Selected GSC cultures expressing high and low levels of CLIC1 mRNA (see Fig. S2) were analyzed by Western blotting altogether with novel cultures to select GSC with low CLIC1 protein content. Western blot analysis of total cell lysates from seven GSC cultures. Membranes were re-probed with α-tubulin antibody after stripping and used as a reference for protein loading (upper panel). Densitometric analysis of CLIC1 levels in the same samples. Data are expressed as mean ± S.D. of CLIC1 densitometric values normalized using respective α-tubulin densitometry (lower panel). GSCs from GBM39 and GBM 44 display low CLIC1 expression as compared to GBM3, 5, 18, and 23. CLIC1 expression in GBM50 was intermediate between these two groups. B Growth curves of low- (GBM39) and high- (GBM3, GBM23) CLIC1-expressing GSCs. Cell viability and proliferation measurement was performed by MTT assay (n = 3). The growth curves were modeled by non-linear third order polynomial fitting. A significant lower proliferation rate was observed in GSCs isolated from GBM39. C Low expressing CLIC1 GSCs retain differentiating ability. Upper pictures: morphological appearance of GBM44 cells grown in stem cell-permissive serum-free medium (STEM, phase contrast microscopic image, bar =10 μm) or after shifting for 2 weeks in 10% FBS-containing medium (DIFF, bar =10 μm). Lower panels: representative western blots of the immunoreactivity for the stem cell marker, Sox2 (left) and for the astrocytic differentiation marker GFAP (right) in GBM44 GSCs and differentiated cell lysates. Membranes were re-probed with β-actin antibody after stripping and used as a reference for protein loading. Histograms report the densitometric analysis of Sox2 and GFAP levels, expressed as mean ± S.D. of densitometric values normalized with β-actin content. GBM44 differentiation is characterized by loss of Sox2 and increased GFAP expression, as occurs in high CLIC1-expressing GBMs. D Upper panels: Immunofluorescence analysis of Sox2 expression in GSC spheroids (upper pictures, bar = 200 μm), GSC monolayers (middle pictures, bar = 100 μm) and differentiated GBM cells (lower pictures, bar = 100 μm) in GBM44 culture. Sox2-positive cells are red and nuclei counterstained with DAPI (blue). Lower panel: GFAP-positive cells (red) in GBM44 GSCs grown as monolayer and their differentiated counterpart. Nuclei were counterstained with DAPI (blue). Bar = 200 μm. E Antiproliferative activity of Q48, Q54 and metformin in low CLIC1-expressing CLIC1 GSCs. Upper panels: concentration-response curves, obtained from MTT assay after 48 h treatment, in low-expressing GBM37 and GBM44 cultures compared with the average response obtained in high-expressing GBM GSCs. Data represent the pooled mean ± SEM from N = 3 independent experiments. Lower Table: mean IC50 value (potency) and maximal inhibition (efficacy) reached for each compound obtained from the concentration-response curves. See the text for description

A Low CLIC1-expressing GSCs, derived from GBM39, are able to grow as 3D organoids. Up-left pictures: representative images soon after plating (day 0) and after 1 week (day 7); bar = 300 μm. Up-right and following pictures: representative images of GBM39 organoids labeled with 5-EdU (green) to evidence cells in active proliferation. Vehicle-treated cells (CTR) display a lower proliferative rate than high CLIC1-expressing organoids (see Fig. 4A). However, 7-day treatment with Q48 and metformin further reduced proliferating cells. Beside Q46 which was ineffective, as already shown on other parameters, also Q54 was unable to reduce organoid cell proliferation in GBM39. bar = 100 μm. B Quantification of Q48, Q54, Q46 (100 μM), and metformin (10 mM) -dependent changes in organoid proliferation rate. Data, obtained using ImageJ software, are reported as % of control values in the graph. Antiproliferative activity is reported comparing the responses in high CLIC1-expressing GSCs (GBM3) and low CLIC1-expressing GSCs (GBM39). Q54 and metformin were also tested on GBM50 which expresses CLIC1 at an intermediate level (see Fig. 5A). While Q48 and metformin reduced proliferation in organoids independently from CLIC1 expression levels, Q54 efficacy was directly proportional to the expression of the channel. *p < 0.05, ***p < 0.001 vs. respective control samples. C Linear regression (R2 = 0.99) correlating CLIC1 expression and Q54 antiproliferative activity in GSC-derived organoids

Acknowledgments
This image is the copyrighted work of the attributed author or publisher, and ZFIN has permission only to display this image to its users. Additional permissions should be obtained from the applicable author or publisher of the image. Full text @ J. Exp. Clin. Cancer Res.