
- Title
-
Marine fungal metabolite butyrolactone I prevents cognitive deficits by relieving inflammation and intestinal microbiota imbalance on aluminum trichloride-injured zebrafish
- Authors
- Nie, Y., Yang, J., Zhou, L., Yang, Z., Liang, J., Liu, Y., Ma, X., Qian, Z., Hong, P., Kalueff, A.V., Song, C., Zhang, Y.
- Source
- Full text @ J Neuroinflammation
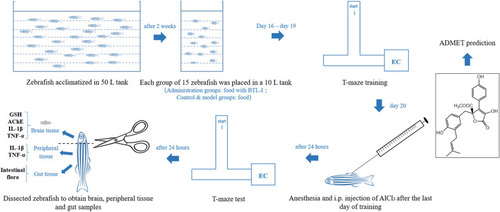
A general diagram summarizing the experimental design used in the present study. Inset: the chemical structure of BTL-I |
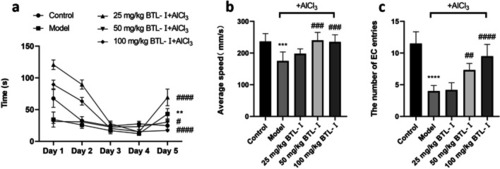
Behavioral performance of zebrafish in the enriched chamber zone of the T-maze test. PHENOTYPE:
|
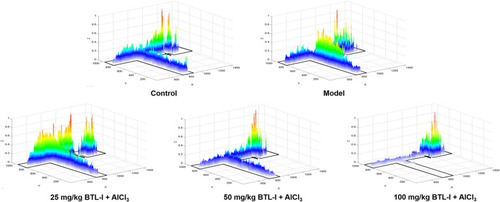
Heatmaps of zebrafish activity in the T-maze on the fifth day. The |
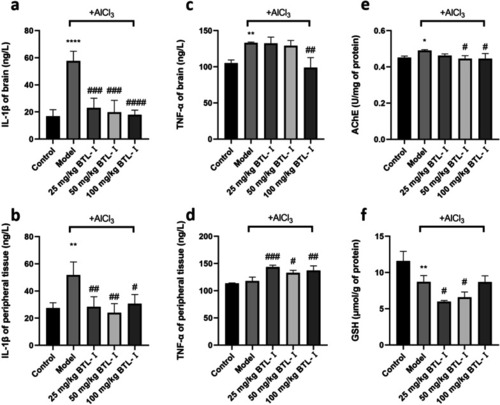
The results of biochemical indices of zebrafish ( PHENOTYPE:
|
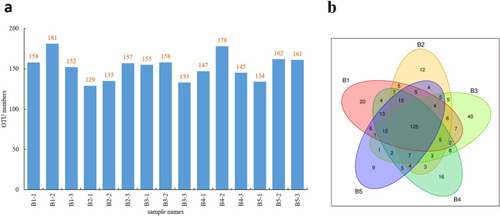
Statistics of the OTUs. |
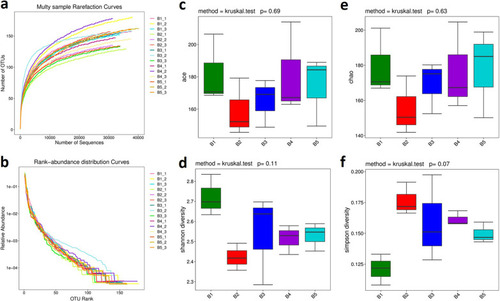
Alpha-diversity. |
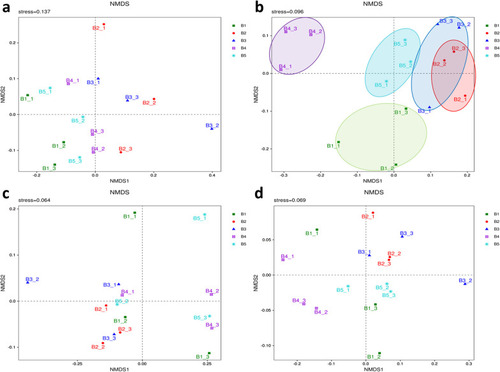
Beta diversity. |

Relative abundance (a and b) and analysis of differential microorganisms (c and d). a and c Results at the phylum level. b and d Results at the genus level. *P < 0.05, **P < 0.01, ***P < 0.005, ****P < 0.001, vs. the control group; #P < 0.05, ##P < 0.01, ###P < 0.005, ####P < 0.001, vs. the model group |
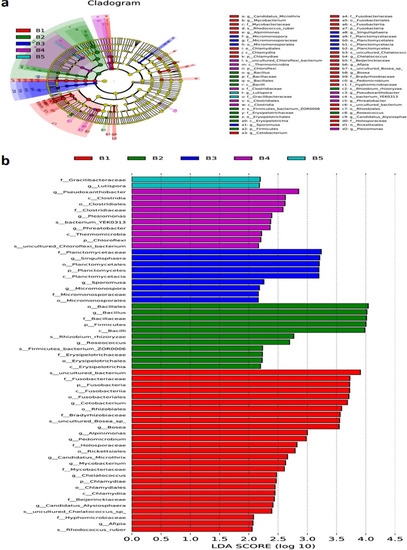
LDA effect size analysis. |