
- Title
-
Bi-allelic variants in neuronal cell adhesion molecule cause a neurodevelopmental disorder characterized by developmental delay, hypotonia, neuropathy/spasticity
- Authors
- Kurolap, A., Kreuder, F., Gonzaga-Jauregui, C., Duvdevani, M.P., Harel, T., Tammer, L., Xin, B., Bakhtiari, S., Rice, J., van Eyk, C.L., Gecz, J., Mah, J.K., Atkinson, D., Cope, H., Sullivan, J.A., Douek, A.M., Colquhoun, D., Henry, J., Wlodkowic, D., Parman, Y., Candayan, A., Kocasoy-Orhan, E., Ilivitzki, A., Soudry, S., Leibu, R., Glaser, F., Sency, V., Undiagnosed Diseases Network, Ast, G., Shashi, V., Fahey, M.C., Battaloğlu, E., Jordanova, A., Meiner, V., Innes, A.M., Wang, H., Elpeleg, O., Kruer, M.C., Kaslin, J., Baris Feldman, H.
- Source
- Full text @ Am. J. Hum. Genet.
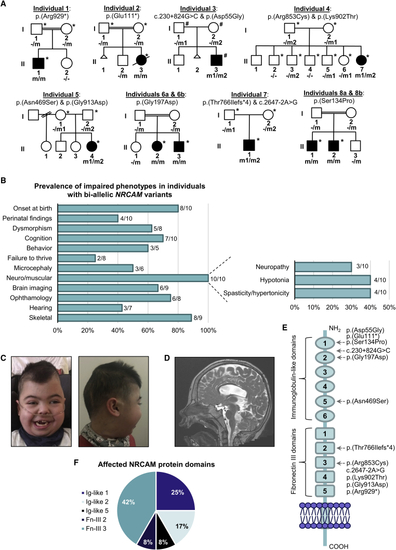
NRCAM variants in individuals with neurodevelopmental disease (A) Pedigrees and variant segregation in eight families with ten affected individuals harboring bi-allelic NRCAM variants; individuals that underwent whole-exome sequencing (∗) and whole-genome sequencing (#) are marked in each family. (B) Frequency of phenotypic features in individuals with bi-allelic NRCAM variants. (C) Facial dysmorphism of individual 1, including bi-temporal narrowing, bushy eyebrows with medial flaring, long eyelashes, depressed nasal bridge, and cupid bowed lips (left) and plagiocephaly (right). (D) Sagittal T2W imaging of individual 1’s brain reveals enlarged third and fourth ventricles and a thinned corpus callosum. The vermis is partially shifted off the midline yet not reduced in size. (E) Schematic representation of the NRCAM protein domains. The location of variants observed in individuals with NRCAM-related disease are highlighted. (F) Distribution of NRCAM variants among protein domains reveals a variant cluster in the third Fn-III domain repeat. |
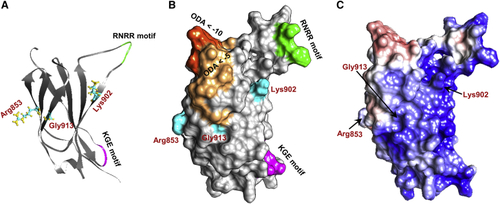
Structural modeling of the NRCAM third fibronectin type III (Fn-III) domain repeat The third Fn-III domain repeat contains a cluster of the variants identified in affected individuals, including three missense variants (p.Arg853Cys, p.Lys902Thr, and p.Gly913Asp) and two predicted loss-of-function variants (p.Arg929∗ and c.2647−2A>G). (A and B) Three-dimensional (3D) structure (A) and surface (B) of the Fn-III 3 domain. Residues involved in nonsynonymous changes—Arg853, Lys902, and Gly913—are depicted in cyan, and the domain’s KGE (magenta) and RNRR (green) motifs are highlighted. Optimal docking area (ODA) computation revealed regions predicted to belong to a protein-protein interface (dark orange represents ODA < −10 and light orange represents regions with ODA < −5). All three mutated residues are located either within or very close to the predicted ODA. Residue Lys902 is also located close to the domain’s KGE and RNRR motifs, which are important for protein-protein interactions. (C) Surface electrostatics analysis shows a clear electrostatic separation between negatively charged (red) and positively charged (blue) regions. The ODA depicted in (B) corresponds to the positively charged patch. |

Zebrafish nrcamaΔ mutants display altered axonal projections and behavioral activity (A and B) Confocal imaging and maximum intensity projection of whole-mount 5-day-old larval brain immunostained against α-tubulin, labeling axonal processes. The brains are imaged from the dorsal side and showing the telencephalon (Tel). Heatmap color scale to demonstrate regions with high fluorescence intensity (black, low intensity and red/white, high intensity). (C) Quantification of fluorescence intensity (arbitrary units, A.U.) show nrcamaΔ mutant larvae display a trend toward an increased number of axons and terminals in the dorsal telencephalon (dashed outline in B) compared to wild-type siblings (p = 0.18; wild type 89.18 ± 19.95 A.U. n = 15; nrcamaΔ 97.50 ± 15.41 A.U., n = 10; variance shown as standard deviation from mean). (D) 5-HT immunostaining of 5-day-old brain imaged from the ventral side, showing hypothalamic cell groups and ascending fiber projections, including the anterior telencephalic commissure (AC). Heatmap color scale to demonstrate regions with high fluorescence intensity (black, low intensity and red/white, high intensity). (E and F) Quantification of fluorescence intensity (arbitrary units, A.U.) in the telencephalon shows a trend toward increased thickness of the anterior commissure (p = 0.15; wild type 26.6 ± 10.3 A.U., n = 16; nrcamaΔ 34.3 ± 13.8 A.U., n = 15; variance shown as standard deviation from mean), and mean intensity (p = 0.16; wild type 131.1 ± 10.9 A.U., n = 16; nrcamaΔ 136.8 ± 7.7 A.U., n = 15; variance shown as standard deviation from mean) in the nrcamaΔ mutant larvae compared to wild-type siblings. (G) Overview of general locomotion in 5-day-old freely swimming nrcamaΔ mutants and wild-type siblings shown as average distance moved in mm during 6 min in white light or darkness. Swimming pattern and trajectory plotted as red line for each genotype in the arena (blue circle). (H) Quantification of general locomotion in light or darkness. Under white light conditions, nrcamaΔ mutants and wild-type siblings displayed similar locomotion behavior (p = 0.99; wild type 550.3 ± 299.8 mm, n = 18; heterozygous nrcamaΔ 466.2 ± 345.1 mm, n = 46; homozygous nrcamaΔ 531.7 ± 526.9 mm, n = 19). However, mutants displayed significantly increased swimming activity in darkness (p = 0.03; wild type 530.3 ± 258.9 mm, n = 27; heterozygous nrcamaΔ 613.7 ± 295.7 mm, n = 47; homozygous nrcamaΔ 764.4 ± 428.2 mm, n = 23). |