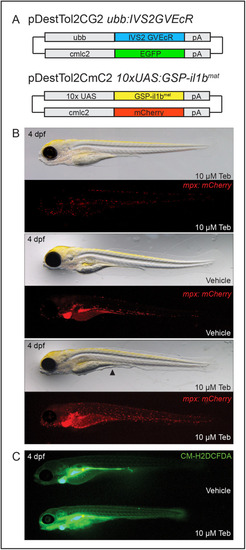
Genetic induction of ubiquitous GSP-Il-1βmat by the ecdysone mimic tebufenozide produces systemic inflammation. (A) Schematic of DNA constructs injected to make the Tg(ubb:IVS2GVEcR, cmlc2:EGFP) and Tg(UAS:GSP-il1bmat, cmlc2:mCherry) lines. Driver lines and responder lines are distinguished by green (cmlc2:EGFP) or red (cmlc2:mCherry) hearts, respectively. (B) Transgenic larvae, expressing the driver and responder transgenes in the Casper mpx:mCherry background, were induced with vehicle (DMSO) or 10 µM Teb at 2 dpf. Fluorescent stereoscope images taken at 4 dpf show neutrophils spreading throughout Teb-induced larvae, while brightfield images reveal a sickly appearance and degradation of the median fin fold (black arrowhead). Casper mpx:mCherry larvae exposed to 10 µM Teb and vehicle exposed Casper mpx:mCherry larvae positive for both driver and responder transgenes appear normal; n=20 for each condition. (C) Larvae were exposed to vehicle or 10 µM Teb at 2 dpf and examined for the formation of ROS using the cell permeant indicator CM-H2DCFDA at 4 dpf. Larvae from each condition were imaged in the same field by fluorescence stereomicroscopy, revealing heightened ROS production in Teb-induced larvae; n=5 for each condition. The gut rapidly absorbs and forms fluorescent product in both larvae (yellow asterisk).
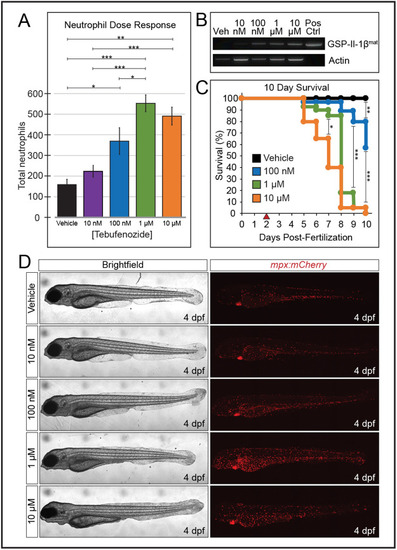
GSP-Il-1βmat driven systemic inflammation is dose dependent. (A) Dose-dependent effects of Teb on neutrophil numbers following 2 days of exposure to either vehicle (DMSO) or increasing concentrations of Teb (n=6 for each concentration, one way ANOVA with Tukey HSD). (B) RT-PCR of GSP-Il-1βmat and actb1 (Actin) at 4 dpf following exposure of embryos to vehicle or the indicated concentration of Teb at 2 dpf. Amplification of linearized plasmid DNA (25 pg) was included as a positive control. (C) Embryos were exposed to vehicle or indicated concentrations of Teb at 2 dpf (red arrowhead) and counted daily for 10 days to obtain Kaplan–Meier survival curves for each cohort, (n=40 for each concentration). (D) Representative images of larvae from (A) at indicated concentrations of tebufenozide. Brightfield images are minimum intensity projections, and mCherry images are maximum intensity projections of confocal stacks acquired for neutrophil counts. For all figures data are shown as the mean±s.e.m. (*P<0.05, **P<0.01, ***P<0.001).
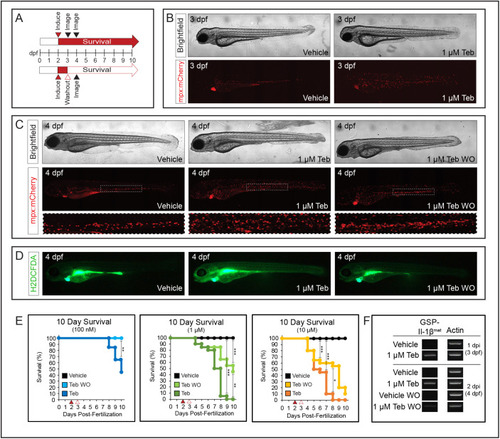
Resolution of inflammation and increased survival following Teb washout. (A) Schematic of experimental approach. Embryos were induced with vehicle (DMSO) or varying concentrations of Teb at 2 dpf (red arrowhead) and either maintained in, or washed to remove, Teb (open red arrowhead) at 3 dpf. Survival was determined daily over 10 days for Teb (red arrow) or washout (open red arrow). Representative images were taken at 3 and 4 dpf (black arrowheads). (B) Representative images of 3 dpf embryos, induced with vehicle or 1 µM Teb at 2 dpf, prior to washout. Tebufenozide induced embryos show increased expansion of neutrophils; n=20 for each condition. (C) Representative images of 4 dpf larvae showing vehicle treated, 48 h of 1 µM Teb exposure, and 24 h 1 µM Teb plus 24 h post-washout (WO). Dashed box shows expanded view of CHT region from each larva. Brightfield images are minimum intensity projections, and mCherry images are maximum intensity projections of confocal stacks; n=20 for each condition. (D) Increased formation of ROS shown using fluorescent indicator dye CM-H2DCFDA in 1 µM Teb-induced larvae relative to vehicle and washout larvae at 4 dpf; n=5 for each condition. (E) Ten-day Kaplan–Meier survival curves showing increased survival for larvae following Teb washout relative to persistent induction at the indicated concentrations of Teb. Embryos were exposed to vehicle, or indicated concentrations of Teb (red arrowhead) at 2 dpf, then either washed at 3 dpf (open red arrowhead), or maintained in the indicated concentration of Teb. Larvae were counted daily for 10 days to determine survival in each cohort; n=20 for each concentration. (F) RT-PCR showing induction of GSP-Il-1βmat relative to actb1 expression (Actin) at 3 dpf and 4 dpf in embryos treated with vehicle or 1 µM Teb, with and without washout. (*P<0.05, **P<0.01, ***P<0.001).
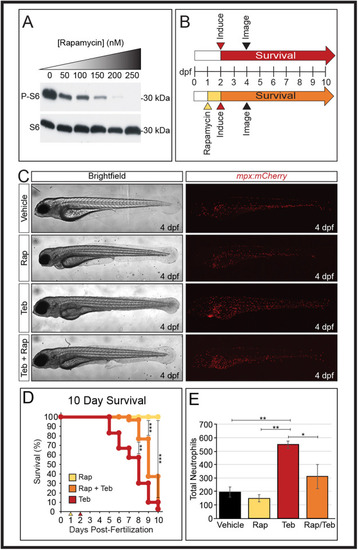
Pre-treatment with the immunosuppressant rapamycin before genetic induction of ubiquitous GSP-Il-1βmat alleviates systemic inflammation. (A) Western blot showing dose-dependent response of ribosomal S6 phosphorylation to increasing rapamycin concentrations (0–250 nM) in zebrafish embryos. The level of total S6 was unaffected by rapamycin treatment. (B) Schematic of experimental approach. Embryos were treated with vehicle (DMSO) or 250 nM rapamycin (Rap) at 1 dpf (yellow arrowhead). At 2 dpf, embryos were induced with vehicle or 1 µM Teb (red arrowhead). Survival was determined daily over 10 days for vehicle, Teb (red arrow), and Teb plus rapamycin (orange arrow) cohorts. In a parallel experiment, larvae were imaged at 4 dpf (black arrowheads) and total neutrophil numbers determined. (C) Representative images of larvae at 4 dpf showing beneficial effects of rapamycin pre-treatment. Vehicle treated, 250 nM rapamycin (Rap) treated, 1 µM Teb, and 250 nM Rap+1 µM Teb-treated larvae are shown. Brightfield images are minimum intensity projections and mCherry images are maximum intensity projections of confocal stacks. (D) Ten-day survival curves showing increased survival for larvae pre-treated with 250 nM rapamycin (Rap) at 1 dpf (yellow arrowhead) followed by 1 µM Teb at 2 dpf (red arrowhead). Rapamycin treatment alone (yellow line) shows equivalent survival to vehicle controls (not shown); n=30 for each cohort. (E) Pre-treatment with 250 nM rapamycin (Rap) reduces total neutrophil number versus 1 µM Teb alone. Vehicle, Rap alone or Rap+Teb were not significantly different from each other; n=3 for each cohort (one way ANOVA with Tukey HSD). (*P<0.05, **P<0.01, ***P<0.001).
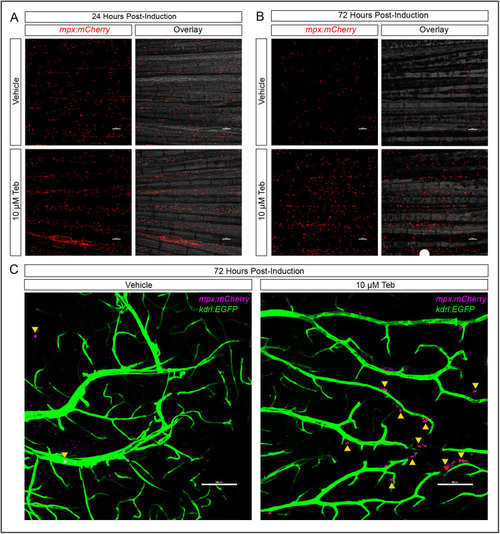
Induction of GSP-Il-1βmat in adult zebrafish triggers a robust neutrophil response. (A) Rapid induction of inflammatory response in adults treated with 10 µM Teb versus vehicle (DMSO) demonstrated by non-invasive imaging of adult caudal fin 24 h post-induction. Maximum intensity projections of mCherry labeled neutrophils in vehicle treated or 10 µM Teb-induced adults are shown adjacent to image merged with minimum intensity projection of brightfield confocal stacks. (B) Continued inflammation at 72 h post-induction shown in adult fin by confocal microscopy. Maximum intensity projections of mCherry labeled neutrophils in vehicle treated or 10 µM Teb-induced adults are shown adjacent to image merged with minimum intensity projection of brightfield confocal stacks. (C) Inflammation on the surface of the optic tectum of adult zebrafish brain at 72 h post-induction with 10 µM tebufenozide relative to vehicle treated controls. Maximum intensity projections of confocal stacks show blood vessels labeled by kdrl:EGFP (green) and neutrophils labeled by mpx:mCherry (pseudo-colored magenta). Note the increased presence of perivascular neutrophils in Teb-induced animals (yellow arrowheads); n=6 for each condition.
Acknowledgments
This image is the copyrighted work of the attributed author or publisher, and
ZFIN has permission only to display this image to its users.
Additional permissions should be obtained from the applicable author or publisher of the image.
Full text @ Biol. Open
Your Input Welcome
Thank you for submitting comments. Your input has been emailed to ZFIN curators who may contact you if
additional information is required.
Oops. Something went wrong. Please try again later.