
- Title
-
Functional characterisation of the amyotrophic lateral sclerosis risk locus GPX3/TNIP1
- Authors
- Restuadi, R., Steyn, F.J., Kabashi, E., Ngo, S.T., Cheng, F.F., Nabais, M.F., Thompson, M.J., Qi, T., Wu, Y., Henders, A.K., Wallace, L., Bye, C.R., Turner, B.J., Ziser, L., Mathers, S., McCombe, P.A., Needham, M., Schultz, D., Kiernan, M.C., van Rheenen, W., van den Berg, L.H., Veldink, J.H., Ophoff, R., Gusev, A., Zaitlen, N., McRae, A.F., Henderson, R.D., Wray, N.R., Giacomotto, J., Garton, F.C.
- Source
- Full text @ Genome Med.
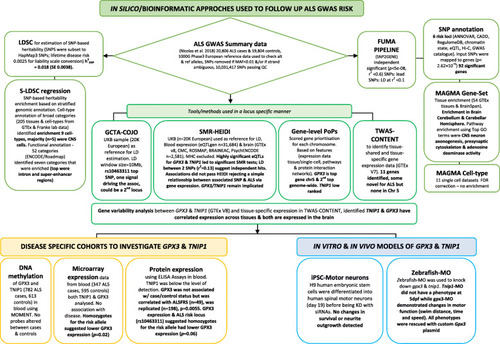
Summary of the in silico, in vitro and in vivo follow-up of ALS GWAS findings. Causal genes/genomic loci implicated by a SNP association are not necessarily the closest (empirical estimate of those that are ~ 30%, Zhu et al. [18]) and the flowchart provides a stepped example on how this paper integrated complementary bioinformatic methods on GWAS summary statistics to prioritise GPX3 and TNIP1 for follow-up in disease cohorts and in vitro (human spinal motor neurons) and in vivo (zebrafish-MO) models. Relevant bioinformatic tools and processes used in this paper are described [5, 18–23]. GWAS genome-wide association study, h2SNP proportion of heritability explained by SNPs, FUMA Functional Mapping and Annotation pipeline, S-LDSC Stratified Linkage Disequilibrium Score regression, GCTA-COJO conditional and joint analysis, SMR-HEIDI Summary Mendelian Randomisation and the HEterogeneity In Dependent Instruments test, TWAS-CONTENT transcriptome-wide association study and context-specific genetics test, PoPS Polygenic Priority Score, siRNA short interfering RNA, iPSC induced pluripotent stem cells, Zebrafish-MO zebrafish morpholino, UKB UK-biobank, chr chromosome |
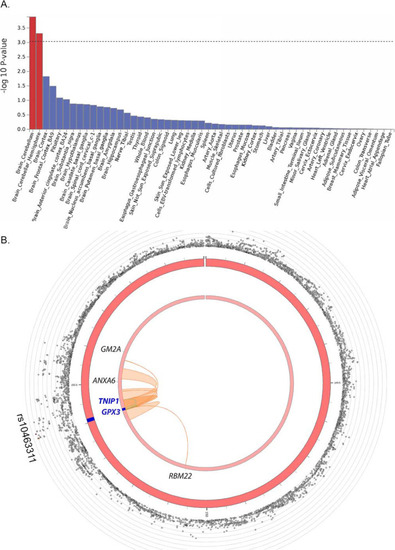
Functional annotation of ALS GWAS. A Using the full GWAS summary data, enrichment of association signal is identified in genes expressed in brain tissue using GTEx v8 (n = 54 tissues). B Circos plot of chromosome 5 with the risk locus in blue (middle circle); outer circle shows SNP associations (grey circles) with -log10(p-value) on the Y-axis. The lead SNP (rs10463311) is labelled, and other SNPs are coloured if they are in LD of the lead SNP (yellow to red, low to high r2, see Fig. Fig.33 for detail). Inner circle: The mapped genes are labelled black if chromatin interaction is detected (GM2A, ANXA6, RBM22), and blue if both a chromatin interaction and an eQTL is detected (TNIP1, GPX3) |
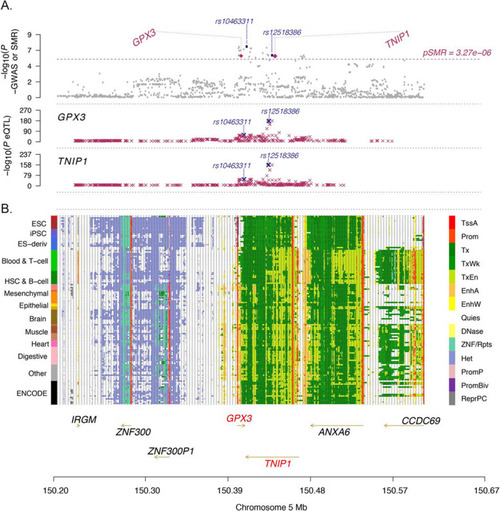
Summary statistics-based Mendelian Randomisation (SMR) analysis identifies GPX3 and TNIP1. Regional map association plot of GPX3 and TNIP1 from summary statistics-based SMR analysis. The x-axis, chromosome position, is the same in all plots. A Grey dots represent the GWAS p-values, with the purple diamonds representing the SMR test p-values for the two genes (GPX3 and TNIP1) probes that pass the SMR genome-wide significance threshold (dashed line). The purple crosses are the association p-values between the SNP and gene probe. The SNP most highly associated with both GPX3 and TNIP1 expression is rs12518386 (GWAS association pGWAS = 8.33 × 10⁻⁷, Beffect GWAS = 0.08, peQTL:GPX3 = 1.05 × 10−171, peQTL:TNIP1 = 2.04 × 10−163). The SNP most associated with ALS is rs10463311 (pGWAS = 4.00 × 10⁻⁸, Beffect GWAS = 0.09, peQTL:GPX3 = 4.85 × 10⁻¹⁸, peQTL:TNIP1 = 1.80 × 10−36) (Additional file 1: Table S12). B The locus is in a region of open chromatin (each row is a cell type, 13 tissue/cell categories in total on the left) including transcriptional areas and enhancers (coloured legend on the right) between GPX3 (transcribed on the forward strand) and TNIP1 (transcribed on the reverse strand) |
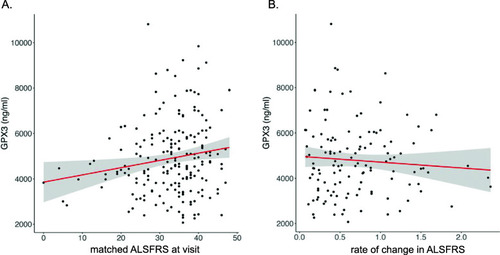
GPX3 protein expression is correlated with clinical measures of ALS function. A Linear regression of ALS functional rating score (matched visit) and GPX3 protein level in plasma (ALSFRS-R, a measure of physical function, high score implies better function) (sex included as a covariate) identifies a positive correlation in ALS cases with functional rating score (ELISA assay, n = 200, p = 0.0055, adjusted R2 = 0.042, y = 3625.4 + 27.4x, SE 13.3). B Linear regression of change in ALSFRS-R per month since time of onset (0 indicates slow progression, 2 indicates fast progression) and GPX3 expression (n = 126, p = 0.025, adjusted R2 = 0.042, y = 4326.7 − 126.3x, SE 284.0) (sex included as a covariate). A similar result was identified in a larger cohort when using proxy dates (when onset date was missing) (Additional file 2: Supplementary Methods) (R2 = 0.031, p = 0.049, for every unit increase rate of progression resulted in a −96 ± 137 ng/ml of GPX3 (mean ± SE) (n = 190) vs. a decrease of −126 ± 284 ng/ml of GPX3 (mean ± SE)) |
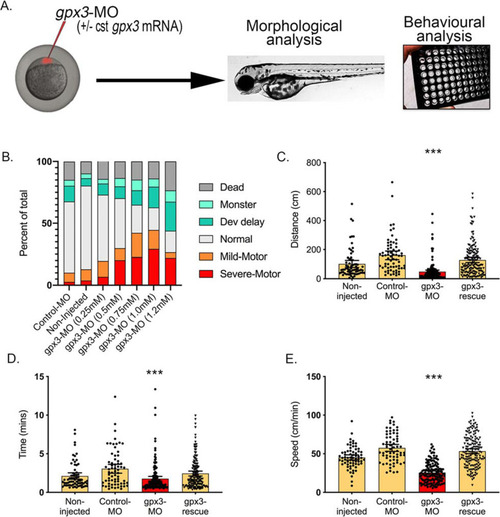
Knockdown of gpx3 in zebrafish-MO results in a motor phenotype. A Zebrafish embryos were injected at the one-cell stage with or without control MO (Control-MO), anti-gpx3 MO (gpx3-MO) or combined anti-gpx3 MO with 100 pg of cst-gpx3 mRNA (gpx3-rescue). Morphological and behavioural analyses were carried out post-fertilisation. B A range of MO concentrations targeting gpx3 indicated a dose-dependent motor-phenotype effect, which peaked at 1 mM without developmental abnormalities (age: 2dpf). C–E The gpx3-MO (1 mM) injected animals moved a smaller distance, for fewer minutes and with an overall lower speed compared to both un-injected and CTR-MO-injected controls. The motor defects were all significantly rescued following co-injection with MO-insensitive gpx3-mRNA (cst-gpx3) (n = 67–158, mean ± 95% CI). Significance indicates the comparison between control-MO and gpx3-MO (p < 0.001). Graphs show individual values, mean and 95% CI error bars. Swim distance, time and speed mean difference and 95% CI: 112 ± 28 mm, 1.29 ± 0.59 s and 32.0 ± 2.53 mm/s, respectively PHENOTYPE:
|
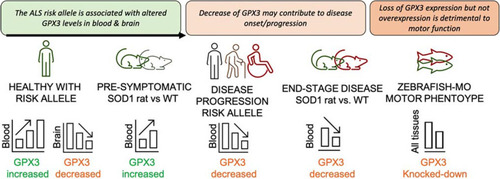
Proposed mechanism to explain GPX3 expression with respect to genotype and disease. In healthy individuals carrying an ALS risk allele, GPX3 levels are increased in blood but decreased in the brain compared to non-carriers (SMR from ALS GWAS, eQTLgen n = 31,684 and brain meta-analyses n = 2581). The ALS SOD1H46R rat model [14] shows an increased level of GPX3 compared to wild-type (WT) controls prior to disease onset. This might indicate GPX3 is being secreted into the circulation to support homeostasis/healthy cellular function via antioxidant mechanisms. In disease, cross-sectional analysis of ALS cases, there is reduced expression level with a more progressed disease (Fig. (Fig.4),4), and at end-stage of disease in SOD1H46R rats, GPX3 levels are lower vs. WT controls. Analysis of cross-sectional ALS cases data shows a trend for homozygotes of the risk allele to have lower levels of GPX3 (microarray and protein, p = 0.02 and p = 0.06 respectively, Additional file 2: Figs. S8 and S9). Independently, an in vivo zebrafish-MO model with knockdown of endogenous gpx3 demonstrates a motor phenotype (reduced swimming time, distance, speed) that is rescued with gpx3 expression, to support its essential role in motor function (Fig. (Fig.5),5), while overexpression of variable doses of GPX3 does not result in a motor specific phenotype (Additional file 2: Fig. S14) |