
- Title
-
Amino acid primed mTOR activity is essential for heart regeneration
- Authors
- Miklas, J.W., Levy, S., Hofsteen, P., Mex, D.I., Clark, E., Muster, J., Robitaille, A.M., Sivaram, G., Abell, L., Goodson, J.M., Pranoto, I., Madan, A., Chin, M.T., Tian, R., Murry, C.E., Moon, R.T., Wang, Y., Ruohola-Baker, H.
- Source
- Full text @ iScience
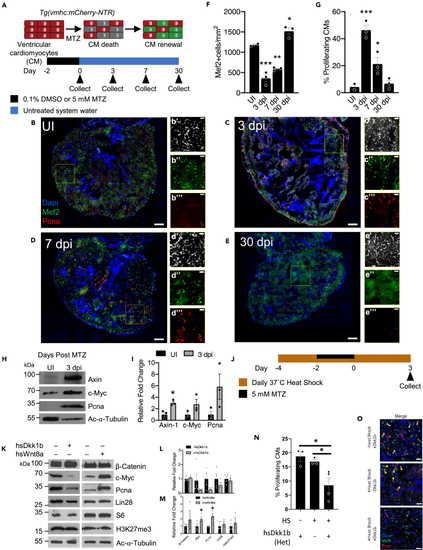
Wnt/β-Catenin regulates the early stages of zebrafish heart regeneration (A) Schematic of adult zebrafish heart ablation experiments. (B–E) Immunohistochemistry of uninjured (UI), 3, 7, and 30 dpi adult zebrafish hearts. Insets show representative areas of the heart, magnified, and with channels split. Scale bar for B–E: 100 μm, area of inset: 200 μm2, scale bar in insets: 25 μm. Blue-DAPI, Red-Pcna, and Green-Mef2c. Yellow arrow heads denote proliferating cardiomyocytes that are Pcna and Mef2c positive. (F and G) Quantification of cardiomyocyte abundance and cardiomyocyte proliferation. After injury, there is a significant increase in proliferating cardiomyocytes as seen by the double staining of Mef2c and Pcna. ∗p < 0.05, ∗∗p < 0.01, ∗∗∗p < 0.001; one-way ANOVA performed. n = 2–3 biological replicates. (H) Protein analysis of UI and 3 dpi hearts for Wnt targets Axin, c-Myc, and Pcna. (I) Quantification of protein analysis in (H). ∗p < 0.05, two-tailed t test performed. N = 3 biological replicates with each N being 3–5 pooled hearts. (J) Schematic of adult zebrafish heart ablation and heat shock protocol for Wnt/β-catenin modulation fish. (K) Protein analysis of Wnt/β-catenin modulation during adult zebrafish heart regeneration. (L and M) Quantification of protein abundance in (K). ∗p < 0.05, two-tailed t test performed. N = 2–5 biological replicates with each N being 3–5 pooled hearts. (N) Quantification of cardiomyocyte proliferation in the context of Wnt/β-catenin repression via hsDkk1b. (O) Immunohistochemistry images of cardiomyocyte proliferation at 3 days postinjury during Wnt/β-catenin inhibition via hsDkk1b overexpression; all animals were presented with MTZ. Scale bar: 25 μm. Blue-DAPI, Red-Pcna, and Green-Mef2c. Yellow arrow heads denote proliferating cardiomyocytes that are Pcna and Mef2c positive. ∗p < 0.05, N = 3–6. One-way ANOVA was performed. Bar graphs show individual data points with error bars representing standard error of the mean. Source data are provided as a Data S2. |
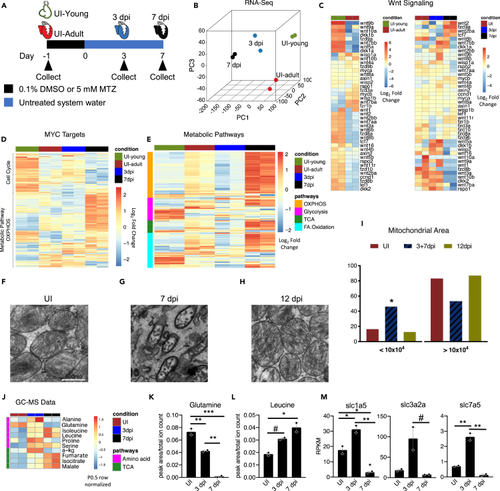
Metabolic pathways are dynamically regulated during the early stages of zebrafish heart regeneration (A) Schematic of zebrafish heart samples prepared for RNA sequencing. (B) Principle component analysis of young uninjured 3-day-old hearts (UI-young), UI adult, 3 dpi, and 7 dpi adult zebrafish hearts. (C) Heatmap of Wnt ligands and Wnt/β-catenin targets in zebrafish hearts. (D) Heatmap of Myc targets in zebrafish hearts. (E) Heatmap of four metabolic pathways in zebrafish hearts. (F–H) Transmission electron microscopy of zebrafish hearts. Scale bar is 500 nm. (I) Mitochondria area quantification in UI, 3+7, and 12 dpi zebrafish hearts. A Chi-squared test was used to assess the ratio between observed/expected. 3dpi and 7dpi showed enrichment in the area bin <10x104 nm2, whereas UI and 12 dpi has depletion in area bin <10x104 nm2. p < 2.2x10⁻¹⁶. (J) Heatmap of significantly different amino acids and TCA cycle intermediates in zebrafish hearts during first week of regeneration. (K) Abundance of glutamine in zebrafish hearts. ∗p < 0.05, ∗∗p < 0.01, ∗∗∗p < 0.001; one-way ANOVA performed. N = 2 with each N being n = 3–5 pooled hearts. (L) Abundance of leucine in zebrafish hearts. ∗p < 0.05, #p = 0.058. N = 2 with each N being 3–5 pooled hearts. (M) RNA-sequencing quantification of glutamine and essential amino acid transporters engaged during mTORC1 activation. ∗p < 0.05, ∗∗p < 0.01, #p = 0.063, one-way ANOVA performed. N = 2 with each N being 3–5 pooled hearts. Bar graphs show individual data points with error bars representing standard error of the mean. Source data are provided as a Data S2. |
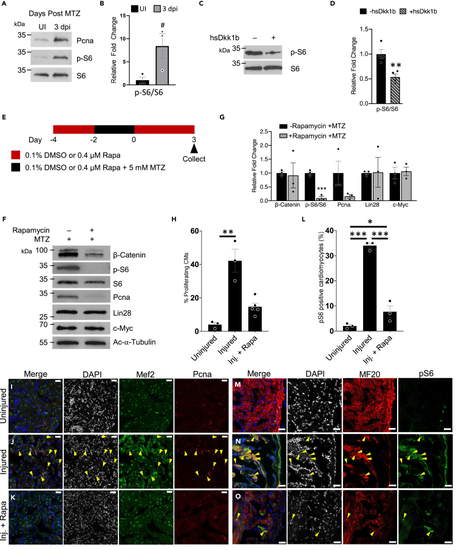
TOR regulates the early stages of zebrafish heart regeneration (A) Protein analysis of TOR activity monitored via the phosphorylation of S6 and proliferation via Pcna in regenerating adult zebrafish hearts. (B) Quantification of pS6/S6 in (A) #p = 0.054, two-tailed t test performed. N = 3 biological replicates with each N being 3–5 pooled hearts. (C) Protein analysis of TOR activity monitored via the phosphorylation of S6 in regenerating adult zebrafish hearts that have Wnt/β-catenin inhibition through the expression Dkk1b. (D) Quantification of westerns in (C) ∗∗p < 0.01, two-tailed t test performed. N = 4 biological replicates with each N being 3–5 pooled hearts. (E) Schematic of adult zebrafish heart ablation and TOR inhibition via rapamycin. (F) Protein analysis of TOR inhibited regenerating adult zebrafish hearts. (G) Quantification of protein abundance in (F). ∗∗∗p < 0.001, two-tailed t test performed. N = 3 biological replicates with each N being 3–5 pooled hearts. (H) Quantification of proliferating cardiomyocytes (Mef2c and Pcna positive cells). One-way ANOVA with pairwise multiple comparison using a Holm-Sidak method were performed. ∗∗p < 0.01. N = 3–5. (I–K) Immunohistochemistry assessing the number of proliferating cardiomyocytes in the adult zebrafish heart 3 dpi after being treated with no rapamycin and no MTZ, uninjured (I), injured (+MTZ) with no rapamycin (J), or injured (+MTZ) with rapamycin (K). Images have scale bars with a 25 μm length. Blue-DAPI, Red-Pcna, and Green-Mef2c. Yellow arrow heads denote proliferating cardiomyocytes, Pcna and Mef2c positive. (L) Quantification of TOR positive cardiomyocytes (MF20 and pS6 positive cells). One-way ANOVA with pairwise multiple comparison using a Holm-Sidak method was performed. N = 3, ∗p < 0.05, ∗∗∗p < 0.001. Immunohistochemistry assessing the number of TOR positive cardiomyocytes in the adult zebrafish heart 3 dpi after being treated with no rapamycin and no MTZ, uninjured (M), injured (+MTZ) with no rapamycin (N), or injured (+MTZ) with rapamycin (O). Scale bars: 25 μm. Bar graphs show individual data points with error bars representing standard error. Source data are provided as a Data S2. |
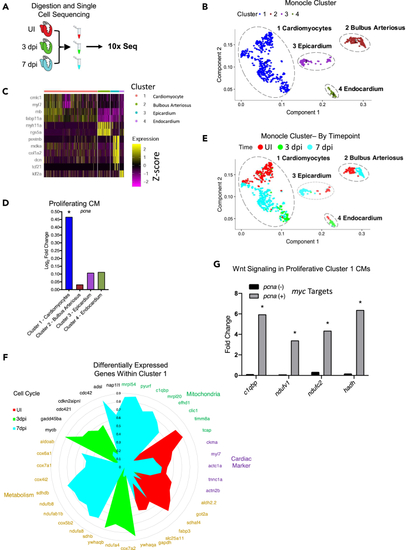
Single-cell sequencing reveals a Wnt responding regenerating cardiomyocyte population during the first week of zebrafish heart regeneration (A) Schematic of the scRNA-sequencing set-up. (B) Principle component analysis of the sequenced cells for UI, 3 dpi, and 7 dpi zebrafish hearts. (C) A heatmap of the genes that highlight the identity of the cell type in each cluster. (D) Transcript levels of the proliferation marker pcna in each of the clusters identifies cluster 1 as a main regenerating cluster. (E) Principle component analysis of the sequenced cells for UI, 3 dpi, and 7 dpi zebrafish hearts separated by cluster and labeled by time. (F) Circle plot of significantly changed genes in dynamically changed pathways during the first week of zebrafish heart regeneration. (G) Transcript levels of Myc target genes (electron transport chain genes) that are significantly upregulated in the subpopulation of cluster 1 cardiomyocytes that are proliferating (pcna positive). ∗p < 0.05. Source data are provided as a Data S2. |
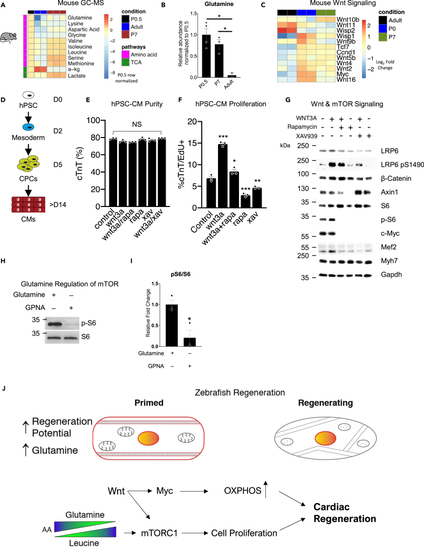
Wnt/β-catenin and mTORC1 are active in regenerating mouse and human cardiomyocytes (A) Heatmap of significantly different amino acids and TCA cycle intermediates in mouse hearts. (B) Abundance of glutamine in mouse hearts. ∗p < 0.05 versus control, one-way ANOVA performed. N = 2–4 biological replicates. (C) Heatmap of Wnt ligands and targets in mouse hearts. (D) Schematic of stem-cell-derived cardiomyocyte (hPSC-CM) generation. (E) Purity of cardiomyocytes after Wnt activation, inhibition, and/or mTORC1 inhibition as determined by FACs. One-way ANOVA performed. N = 3 biological replicates. (F) Percentage of proliferating hESC-CMs after Wnt activation, inhibition, and/or mTORC1 inhibition as determined by FACs. ∗p < 0.05, ∗∗p < 0.01, ∗∗∗p < 0.001, one-way ANOVA performed. N = 3 biological replicates. (G) Protein analysis of hPSC-CMs after Wnt activation, inhibition, and/or mTORC1 inhibition. (H) Protein analysis of hPSC-CMs mTORC1 activation after glutamine transporter inhibition via GPNA. N = 3 biological replicates. (I) Quantification of p-S6/S6 blots in (H). ∗p < 0.05, two-tailed t test performed. (J) Schematic of amino acid primed proregenerative cardiomyocyte and the signaling cascade that Wnt/β-catenin drives to turn on mTORC1, Lin28, and Myc to bring about zebrafish heart regeneration. Bar graphs show individual data points with error bars representing standard error of the mean. Source data are provided as a Data S2. |