
- Title
-
Investigating Pathogenicity and Virulence of Staphylococcus pettenkoferi: An Emerging Pathogen
- Authors
- Ahmad-Mansour, N., Plumet, L., Huc-Brandt, S., Magnan, C., Yahiaoui-Martinez, A., Kissa, K., Pantel, A., Lavigne, J.P., Molle, V.
- Source
- Full text @ Int. J. Mol. Sci.

Growth of S. pettenkoferi SP165. (A) Growth kinetics of S. pettenkoferi SP165 (blue circles) and S. aureus SA564 (grey circles) strains in TSB. At a culture to flask volume of 1:10, cells were grown at 37 °C and 225 rpm. At each time point (n = 3), the data show the mean A600 readings SD. Welsh’s t test, ** p < 0.01. (B) Growth of S. pettenkoferi SP165 (left panel) compared with S. aureus SA564 (right panel) phenotype on TSB agar plate grown at 37 °C for 48 h. (C) Kinetics of the complete biofilm formation determined by crystal violet experiment. The optical density (500 nm) is directly linked to the biofilm formation. Means and standard errors for six independent replicates are presented. Statistical differences were obtained by Mann–Whitney; ns, not significant. |
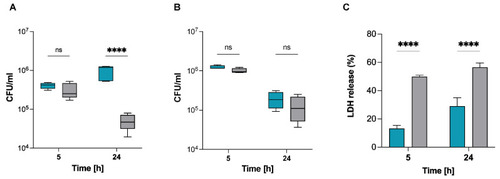
S. pettenkoferi SP165 survival in infected macrophages. S. pettenkoferi SP165 (blue) and S. aureus SA564 (grey) bacteria were used to infect RAW 264.7 (A) or THP-1 (B) macrophages. The amount of bacteria after 5 and 24 h pGt was evaluated after infection at a multiplicity of infection (MOI) of 20. The average and standard deviation (SD) of five different experiments are represented. (C) LDH release was measured using the CyQUANT assay kit after RAW 264.7 macrophage cells were infected at a MOI of 20 for 5 and 24 h, with the exception that the cells were seeded in a 96-well plate and that the extracellular bacteria were not eliminated. Data are expressed relative to the 100% positive control (n = 3 biological repeats). A two-way ANOVA test was used to establish statistical significance, with **** p < 0.0001; ns, not significant. |

Survival capacity of S. pettenkoferi SP165 in non-professional phagocytes. (A) At a MOI of 100, bacteria from S. pettenkoferi SP165 (blue) and S. aureus SA564 (grey) were utilized to infect cells of the keratinocyte cell line HaCaT, and the cells were co-cultured for 90 min. Washing and lysostaphin/gentamicin treatment were used to eliminate extracellular and adhering bacteria, and infected cells were grown for up to 48 h in cell culture media supplemented with lysostaphin. Eukaryotic cells were lysed, and surviving bacteria in lysates were evaluated by counting CFUs at 5, 24, and 48 h after lysostaphin/gentamicin treatment. Percentage survival = (#CFUfinal/#CFUinput) ∗ 100. (B) LDH release was measured using the CyQUANT assay kit after HaCaT cells were infected at a MOI of 100 for 5, 24 and 48 h, with the exception that the cells were seeded in a 96-well plate, and the extracellular bacteria were not eliminated. Data are expressed relative to the 100% positive control. Statistical significance was determined by two-way ANOVA test where ns, non-significant; * p < 0.05; **** p < 0.0001. n = 4 biological repeats. |
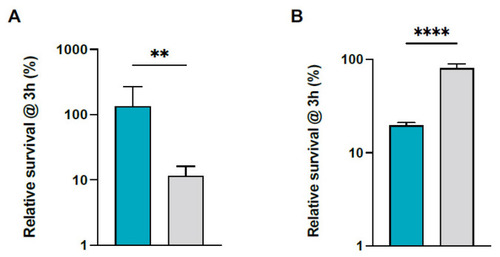
S. pettenkoferi SP165 and S. aureus SA564 survival in whole blood. Percentage survival of S. pettenkoferi SP165 (blue) and S. aureus SA564 (grey) in (A) freshly collected human whole blood and (B) human plasma. Bacteria were cultivated overnight, diluted, inoculated in blood or human plasma, maintained for 3 h at 37 °C, and rotated. Percentage survival = (CFUtimepoint/CFUinitialinput) ∗ 100. The data are the average with standard deviation of five separate experiments. ** p < 0.01; **** p < 0.0001 (Mann–Whitney U test). |

Virulence of S. pettenkoferi SP165 and S. aureus SA564 strains in zebrafish embryos. Kaplan–Meier representation of the survival of (A) healthy zebrafish embryos or (B) zebrafish embryos injured in the tail fin at 48 h post-fertilization (hpf) in a bath infected with S. pettenkoferi SP165 or S. aureus SA564 strains at 2.107 CFU/mL grown in exponential phase or “fish water” (negative control). The proportion of surviving embryos (n = 24 for each, indicative of three separate experiments) is used to express the results. Significant difference at ** p < 0.01, **** p < 0.0001, or no significant difference (ns). |

BRIG analysis of S. pettenkoferi genomes. The SP165 strain was compared against the two genomes previously described in the literature. The inner blue ring represents the SP165 genome; the middle red one shows the FDAARGOS 288 genome after BLASTn match; while the outer green ring corresponds to FDAARGOS 1071. Only regions with >90% nucleotide identity are colored. Lower identity percentage or no match are represented by blank spaces in each ring. The inner bicolor ring corresponds to the GC skew of S. pettenkoferi SP165 isolates. Green profile indicates overabundance of GC nucleotides, whereas purple shows the opposite. The inner black ring represents the GC%. |