
- Title
-
Zebrafish foxc1a controls ventricular chamber maturation by directly regulating wwtr1 and nkx2.5 expression
- Authors
- He, L., Zhang, Q., Jiang, D., Zhang, Y., Wei, Y., Yang, Y., Li, N., Wang, S., Yue, Y., Zhao, Q.
- Source
- Full text @ J. Genet. Genomics
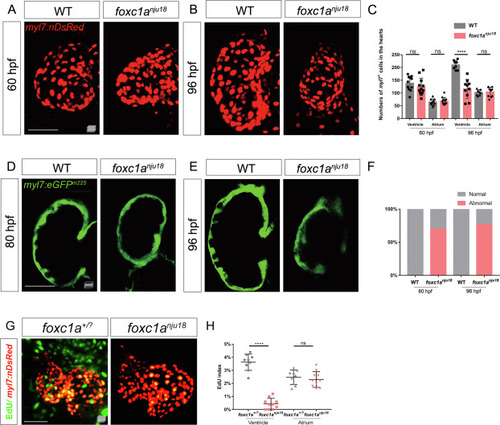
Fig. 1. Ventricular development defects are observed during the trabecular stage in foxc1anju18 mutants. A: Maximum intensity projections of confocal z-stacks show representative ventricles of 60 hpf Tg(myl7:nDsRed);foxc1a+/+ (n = 11) and Tg(myl7:nDsRed);foxc1anju18 (n = 12) embryos. B: Maximum intensity projections of confocal z-stacks show representative hearts of 96 hpf WT (n = 8) and foxc1anju18 (n = 10) embryos. C: A scatter plot shows the numbers of cardiomyocytes in the atria and ventricles. D: Midsagittal confocal images show hearts of 80 hpf Tg(myl7:eGFP)m225;foxc1a+/+ (n = 14) and Tg(myl7:eGFP)m225;foxc1anju18 (n = 10) embryos. E: Midsagittal confocal images show hearts of 96 hpf Tg(myl7:eGFP)m225; foxc1a+/+ (n = 13) and Tg(myl7:eGFP)m225;foxc1anju18 (n = 17) embryos. F: Statistical analysis of data derived from (D) and (E). G: Maximum intensity projections of confocal z-stacks show representative EdU-stained hearts from 84 hpf Tg(myl7:nlsRed);foxc1a+/? (n = 9) and Tg(myl7:nDsRed);foxc1anju18 (n = 10) embryos. H: A scatter plot shows the percentage of EdU+ cells. Scale bars, 50 μm. ns, P > 0.05; ∗∗, P < 0.01; ∗∗∗, P < 0.001; ∗∗∗∗, P < 0.0001. Error bars represent the standard deviation. hpf, hour postfertilization. |

Fig. 2. Foxc1a is expressed in ventricular cardiomyocytes after 64 hpf. A and B: Confocal sagittal sections of foxc1anju80 embryos at 19 ss and 26 hpf. The white arrow in (A) points to the cardiac cone region. A lateral view with the abdomen oriented to the left and the head upward (A). A lateral view with the abdomen oriented to the right and the head upward (B). C–I: Confocal sagittal sections of Tg(myl7:nDsRed);foxc1anju80/+ in-crossed embryos from 32 hpf to 108 hpf. All images are ventral views with the heads oriented upward. The myl7+ cells are labeled in red, and the foxc1a+ cells are labeled in green. The white arrows in (F–I) indicate representative colocalized cells. J and K: Representative projections of in vivo confocal images show the representative hearts of Tg(kdrl:ras-mCherry);foxc1anju80/+ in-crossed embryos. Both images show ventral views with the head upward. The white arrow in (K) indicates a representative foxc1a+ cell. The kdrl+ cells are labeled in red, and the foxc1a+ cells are labeled in green. Scale bars, 50 μm. ss, somite stage; hpf, postfertilization. EXPRESSION / LABELING:
|
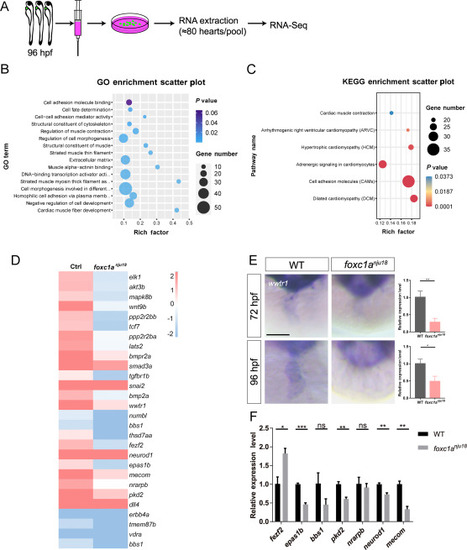
Fig. 3. Gene expression profiling of foxc1a nju18 hearts. A: A flow chart of the heart collection and RNA extraction process. B: GO analysis shows significant GO terms. C: KEGG pathway analysis shows enriched KEGG terms obtained. D: A heatmap of 28 selected differentially expressed genes from the RNA sequencing data. The color blocks indicate the direction and degree of the fold change (log2[FC] values). E: Whole-mount in situ hybridization (WISH) and quantitative real-time PCR (qRT-PCR) of 72 hpf and 96 hpf hearts show the expression patterns of wwtr1. Sample size of WISH: WT (n = 5), foxc1a nju18 (n = 3) at 72 hpf; WT (n = 7), foxc1a nju18 (n = 8) at 96 hpf. All images are ventral views with the head oriented upward. F: The qRT-PCR evaluating the expression levels of Notch signaling related genes in the hearts of foxc1a nju18 mutants and WT siblings. ∗, P < 0.05; ∗∗, P < 0.01. Error bars represent the standard deviation. EXPRESSION / LABELING:
PHENOTYPE:
|

Fig. 4. wwtr1 is directly regulated by Foxc1a and can partially rescue zebrafish ventricular chamber maturation defects. A: A schematic diagram (top) of the zebrafish wwtr1 promoter. The dual-luciferase reporter assays (bottom) show that the 1550 bp, 935 bp, and 662 bp promoters of wwtr1 all responded to Foxc1a. B: The chromatin immunoprecipitation assays indicate that there are at least three binding sites for Foxc1a in the 1189 bp wwtr1 promoter. C: A dual-luciferase reporter assay performed with mutated wwtr1 promoters (P1, P2, P3, and P1-3 deletion). D: Fluorescence images of representative 96 hpf hearts from WT and foxc1a nju18 in the VD and VS phases after microinjection of wwtr1 mRNA. The dashed line represents the short axis of the ventricle. ‘-inj’ indicates embryos that were microinjected with wwtr1 mRNA at 1-cell stage. E: A scatter plot shows the shortening fraction in WT (n = 21), foxc1a nju18 (n = 25), WT-inj (n = 24), and foxc1a nju18-inj (n = 21) embryos. F: Maximum intensity projections of confocal z-stacks show representative 96 hpf hearts of WT-inj and foxc1a nju18-inj zebrafish. G: A scatter plot shows the number of ventricular cells in WT (n = 19), foxc1a nju18 (n = 10), WT-inj (n = 19), and foxc1a nju18-inj (n = 18) embryos. H: A scatter plot shows the pericardial edema indexes of WT (n = 20), foxc1a nju18 (n = 29), WT-inj (n = 24), and foxc1a nju18-inj (n = 30) embryos at 108 hpf. All images are ventral views with the head oriented upward. I: The diagram shows that the percentage of embryos with an abnormal trabecular phenotype was reduced after microinjection of wwtr1 mRNA. ∗, P < 0.05; ∗∗, P < 0.01; ∗∗∗, P < 0.001; ∗∗∗∗, P < 0.0001; ns, P > 0.05; Error bars represent the standard deviation. Scale bars, 50 μm. TSS, transcription start site; NC, negative control site; V, ventricle; A, atrium; VD, ventricular diastole; VS, ventricle systole. |
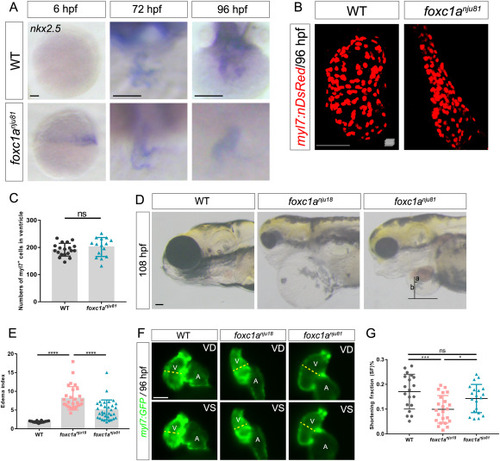
Fig. 5. The defects observed in the foxc1a nju18 ventricle can be partially abated by the conditional knockin of nkx2.5 in foxc1a+ cells. A: The WISH results reveal that the expression of nkx2.5 is rescued in foxc1a nju81 hearts. Sample size: WT (n = 10), foxc1a nju81 (n = 15) at 6 hpf; WT (n = 9), foxc1a nju81 (n = 6) at 72 hpf; WT (n = 14), foxc1a nju81 (n = 7) at 96 hpf. The 6 hpf embryos are lateral views with the animal pole oriented upward. The 72 and 96 hpf embryos are ventral views with the head oriented upward. B: Maximum intensity projections of confocal z-stacks show representative hearts of WT (n = 19) and foxc1a nju81 (n = 15) embryos at 96 hpf. C: A scatter plot shows the numbers of ventricular cells. D: Lateral views of WT, foxc1a nju18, and foxc1a nju81 embryos. a, The distance from the center of the ventricle to the edge of the heart; b, the distance from the center of the ventricle to the edge of the pericardium. E: A scatter plot shows the pericardial edema indexes of the WT (n = 20), foxc1a nju18 (n = 29), and foxc1a nju81 (n = 33) embryos at 108 hpf. F: Representative hearts of foxc1a nju18 and foxc1a nju81 embryos at 96 hpf. G: A scatter plot shows the SF in WT (n = 21), foxc1a nju18 (n = 25), and foxc1a nju81 (n = 21) embryos. ∗, P < 0.05; ∗∗, P < 0.01; ∗∗∗, P < 0.001; ∗∗∗∗, P < 0.0001; ns, P > 0.05; Error bars represent the standard deviation. Scale bars, 50 μm (A, B, F); 100 μm (D). V, ventricle; A, atrium; VD, ventricular diastole; VS, ventricular systole. |
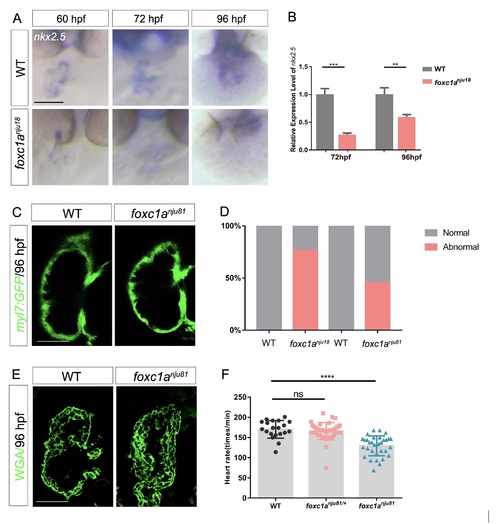
The conditional knockin of nkx2.5 partially rescued ventricular chamber maturation. A: The WISH results show the reduced expression of nkx2.5 in foxc1a nju18 hearts. Sample size: WT (n = 10), foxc1a nju18 (n = 15) at 60 hpf; WT (n = 9), foxc1a nju18 (n = 5) at 72 hpf; WT (n = 14), foxc1a nju18 (n = 9) at 96 hpf. B: The qRT-PCR results show the reduced expression of nkx2.5 in foxc1a nju18 hearts at 72 and 96 hpf. C: Mid-sagittal confocal images show the representative hearts of 96 hpf WT (n = 7) and foxc1a nju81 (n = 10) embryos. D: The statistical analysis derived from C exhibits the rescued trabeculae structure in foxc1a nju81 hearts. E: 96 hpf cryosections were stained with WGA to observe cell-membranes. F: A scatter plot shows the decreased heart rate in 108 hpf foxc1a nju81 hearts. Sample size: WT (n = 19), foxc1a nju81/+ (n = 29), foxc1a nju81 (n = 33). Scale bar, 50 μm. ns, P > 0.05; ***, P < 0.001. Error bars, S.D. |
Reprinted from Journal of genetics and genomics = Yi chuan xue bao, 49(6), He, L., Zhang, Q., Jiang, D., Zhang, Y., Wei, Y., Yang, Y., Li, N., Wang, S., Yue, Y., Zhao, Q., Zebrafish foxc1a controls ventricular chamber maturation by directly regulating wwtr1 and nkx2.5 expression, 559-568, Copyright (2021) with permission from Elsevier. Full text @ J. Genet. Genomics