
- Title
-
Pediococcus pentosaceus Enhances Host Resistance Against Pathogen by Increasing IL-1β Production: Understanding Probiotic Effectiveness and Administration Duration
- Authors
- Shan, C., Li, M., Liu, Z., Xu, R., Qiao, F., Du, Z.Y., Zhang, M.L.
- Source
- Full text @ Front Immunol
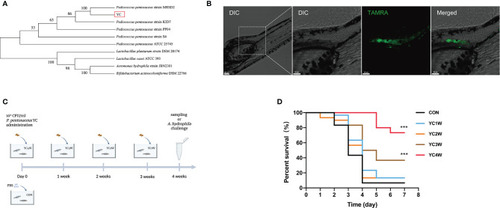
Administration of the isolated bacteria YC and its protective effect on the resistance against A. hydrophila of zebrafish. (A) Phylogenetic tree of the isolated bacteria bacterium. Distance was calculated by using 16S rRNA gene based on the neighbor-joining criterion and the bootstrap confidence values were 100 replicates. (B) Confocal fluorescence imaging of zebrafish larvae (4 dpf) immersed in water containing 106 CFU/ml P. pentosaceus YC (pre-treated with 300 µM TAMRA) for 24 h. (C) Experimental design for accessing the protective effect of P. pentosaceus YC administration. YC was administrated into water at a concentration of 106 CFU/ml for 1 week (YC1W), 2 weeks (YC2W), 3 weeks (YC3W), and 4 weeks (YC4W). PBS treatment as control group (CON). YC or PBS were provided every 24 h for different durations. (D) Survival curve of zebrafish from different groups following 108 CFU/ml A. hydrophila challenge. Each curve represents the sum of three independent tanks. ***p < 0.001 by Mantel–Cox test. |
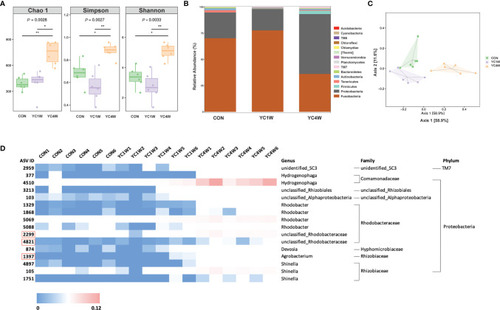
Administration of P. pentosaceus YC for 4 weeks alerts gut microbiota composition. 16S rRNA gene sequencing of zebrafish intestinal contents from each group (n = 6). (A) Alpha diversity metrics, p-values were identified with Kruskal–Wallis rank sum test. (B) Gut microbiota community of each group at the phylum level. (C) Principal coordinate analysis (PCoA) based on Bray–Curtis dissimilarity matrices to show beta diversity among groups at ASV level. (D) Heatmap analysis of 16 significantly changed ASVs in the YC4W group compared with the CON and YC1W group. The color bar of each ASV in each treatment is shown. The taxonomy of the ASVs (genus, family, and phylum) is described on the right. |
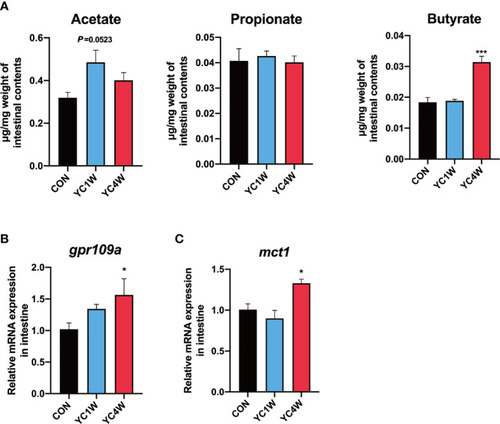
Gut microbiota alteration induces the accumulation of gut butyrate. (A) Intestinal short-chain fatty acid levels in CON, YC1W, and YC4W groups (n = 3). (B) Relative mRNA expression of butyrate-sensing receptor gene gpr109a and (C) butyrate transporter gene mct1 in zebrafish intestine (n = 6). Data are presented as mean ± SEM. *p < 0.05; ***p < 0.001 by one-way analysis of variance followed by Dunnett’s multiple comparisons test. |
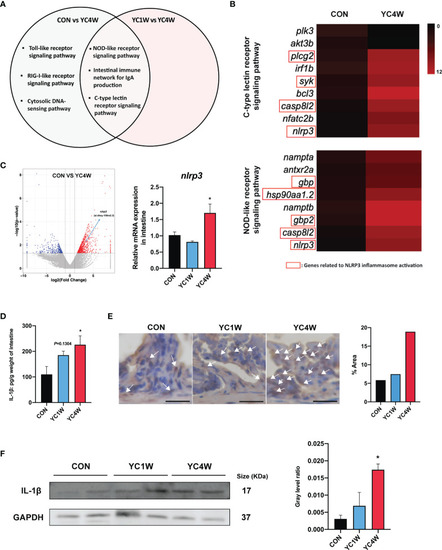
P. pentosaceus YC contributes to NLRP3 inflammasome activation after a 4-week administration. Differentially expressed genes (CON vs. YC4W, YC1W vs. YC4W) of zebrafish intestine were analyzed and used for pathway classification based on KEGG enrichment analysis. (A) Immune-related pathways changed in both comparison CON vs. YC4W and YC1W vs. YC4W. (B) Heatmap of differentially expressed genes of C-type lectin receptor signaling pathway and NOD-like receptor signaling pathway in comparison to CON vs. YC4W. (C) Differentially expressed intestinal genes in comparison to CON vs. YC4W and relative nlrp3 mRNA quantification of zebrafish intestine by qPCR (n = 6). (D) ELISA analysis of intestinal IL-1β level of zebrafish from CON, YC1W, and YC4W groups (n = 6). Representative (E) immunohistochemical and (F) Western blot analysis of intestinal IL-1β of zebrafish from CON, YC1W, and YC4W groups. Scale bars represents 20 µm. Data are represented as mean ± SEM. *p < 0.05 by one-way analysis of variance followed by Dunnett’s multiple comparisons test. |

Sodium butyrate addition shows similar protective effect of P. pentosaceus YC in pathogen resistance on zebrafish. (A) Intestinal butyrate levels of zebrafish fed on commercial diet supplemented with 0 mmol/kg (CON) and 10 mmol/kg (SB10) sodium butyrate (n = 3). (B) Survival curve of zebrafish from CON and SB10 groups following 108 CFU/ml A. hydrophila challenge. Each curve represents the sum of three independent tanks. ***p < 0.001 by Mantel–Cox test. (C) ELISA analysis of intestinal IL-1β level of zebrafish from CON and SB10 groups (n = 6). (D) Representative Western blot of intestinal IL-1β of zebrafish from the CON and SB10 group. (E) Survival curve of zebrafish following 109 CFU/ml A. hydrophila challenge. Zebrafish were pretreated with 10 mmol/kg sodium butyrate for 1 week and then gavaged with PBS (SB-Mock), 50 µM non-targeting (SB-NC), or il1b (SB-il1b siRNA) siRNA. Asterisks indicate significant differences between SB-Mock and SB-il1b siRNA. *p < 0.05 by Mantel–Cox test. (F) Flow cytometry analysis of zebrafish intestinal neutrophils stained with anti-CD11b and anti-Ly6G antibodies (n = 3). Numbers indicate the percentage of CD11b+Ly6G+ neutrophils in intestinal cells. Data are represented as mean ± SEM. *p < 0.05; **p < 0.01; ***p < 0.001 by Student’s t-test. |
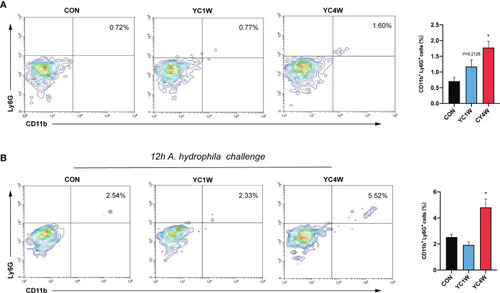
Four-week P. pentosaceus YC administration increases the intestinal neutrophils of zebrafish and enhances the recruitment of neutrophils under pathogen infection. (A) Flow cytometry analysis of intestinal neutrophils of zebrafish from CON, YC1W, and YC4W groups (n = 3). (B) Flow cytometry analysis of intestinal neutrophils of zebrafish from CON, YC1W, and YC4W group. All zebrafish were challenged with 108 CFU/ml A. hydrophila for 12 h before intestine collection (n = 3). Numbers indicate the percentage CD11b+Ly6G+ neutrophils in intestinal cells. Data are represented as mean ± SEM. *p < 0.05 by one-way analysis of variance followed by Dunnett’s multiple comparisons test. |