
- Title
-
The Zebrafish Antiapoptotic Protein BIRC2 Promotes Edwardsiella piscicida Infection by Inhibiting Caspases and Accumulating p53 in a p53 Transcription-Dependent and -Independent Manner
- Authors
- Cao, L., Yan, D., Xiao, J., Feng, H., Chang, M.X.
- Source
- Full text @ Front Immunol
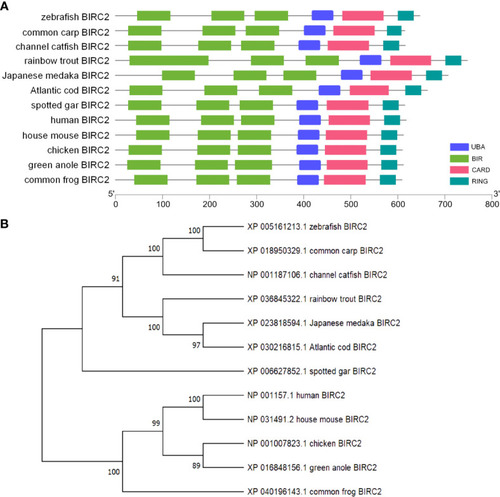
Bioinformatics analysis of zebrafish BIRC2. (A) Schematic diagram of the modular domain architecture of vertebrate BIRC2. (B) Phylogenetic tree of vertebrate BIRC2. The amino acid sequences are aligned using CLUSTALW, and the tree is constructed by the N-J method supported with 10,000 bootstrap replications using MEGA X software. |
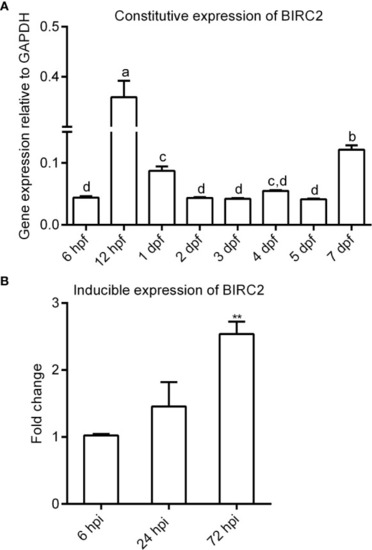
The expression patterns of zebrafish BIRC2. (A) The constitutive expression of zebrafish BIRC2 in zebrafish embryos and larvae. Means with different letters are statistical different. (B) The inducible expression of zebrafish BIRC2 in zebrafish larvae infected with E. piscicida. Data represented the means ± the SEM (n = 3) and were tested for statistical significance using a two-tailed student’s t-test or one-way ANOVA. **p < 0.01. |
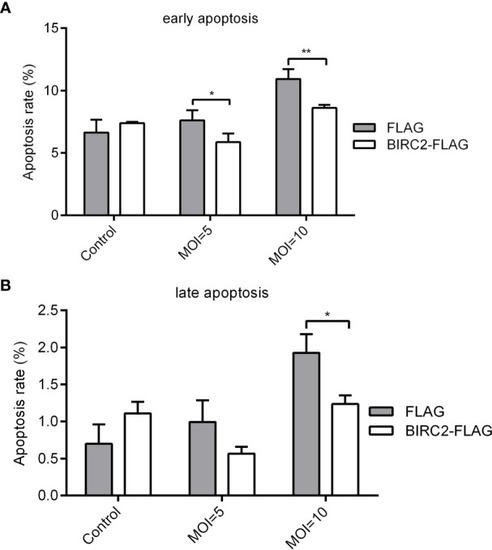
Overexpression of zebrafish BIRC2 inhibits the early and late apoptosis in the case of E. piscicida infection. (A) The effect of zebrafish BIRC2 on the early apoptosis. (B) The effect of zebrafish BIRC2 on the late apoptosis. The EPC cells transfected with p3×FLAG or BIRC2-FLAG were infected with E. piscicida at an MOI of 5, 10 or left untreated. At 6 hpi, samples were collected, then stained with annexin V FITC, and finally analyzed by cytoflex S Flow Cytometer. Data represented the means ± the SEM (n = 3) and were tested for statistical significance using a two-tailed student’s t-test. *p < 0.05; **p < 0.01. |
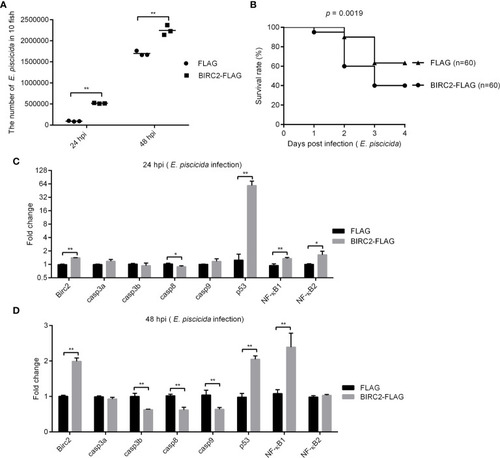
Negative regulation of zebrafish BIRC2 on E. piscicida infection. (A) The effect of zebrafish BIRC2 on the bacteria proliferation. (B) The effect of zebrafish BIRC2 on the larvae survival in response to E. piscicida infection. (C, D) The effect of zebrafish BIRC2 on the expression levels of apoptosis-related genes and NF-κB genes at 24 and 48 hpi. Zebrafish larvae microinjected with the p3×FLAG plasmid were used for control group. The housekeeping gene GAPDH was used for normalizing the Ct values of target genes. The fold changes relative to 1 control group were calculated using the 2−ΔΔCt method. Data represented the means ± the SEM (n = 3) and were tested for statistical significance using a two-tailed student’s t -test. *p < 0.05; **p < 0.01. |
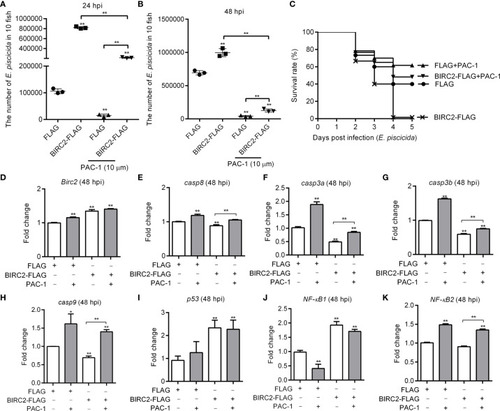
The caspase activator PAC-1 blocks the negative regulation of zebrafish BIRC2 on the E. piscicida infection. (A) PAC-1 inhibited the zebrafish BIRC2-mediated bacterial proliferation at 24 hpi. (B) PAC-1 blocked the zebrafish BIRC2-mediated bacterial proliferation at 48 hpi. For (A, B), larvae were collected at 24 and 48 hpi, and used for colony count. Data represented the means ± the SEM (n = 3) and were tested for statistical significance using a two-tailed student’s t -test. **p < 0.01. The asterisk above the error bars indicates statistical significance using the group microinjected with empty plasmid and without treatment as the control group. The asterisk above the bracket indicates statistical significance between the two groups connected by the bracket. (C) The effect of PAC-1 on the survival rates of zebrafish larvae microinjected with p3×FLAG or BIRC2-FLAG in the case of E. piscicida infection. Exposures were performed in triplicate with 20 larvae per repetition (n = 60). Statistical differences using the log-rank test were observed between the FLAG/BIRC2-FLAG groups (p < 0.0001), FLAG/FLAG+PAC-1 groups (p < 0.05), and BIRC2-FLAG/BIRC2-FLAG+PAC-1 groups (p < 0.0001). (D–K) The effect of PAC-1 on the expression levels of apoptosis-related genes and NF-κB genes in zebrafish larvae microinjected with p3×FLAG or BIRC2-FLAG at 48 hpi. For (D–K), larvae were collected at 48 hpi, and used for qRT-PCR. Data represented the means ± the SEM (n = 3) and were tested for statistical significance. *p < 0.05; **p < 0.01. For (A–K), 4 dpf larvae microinjected with the p3×FLAG or BIRC2-FLAG were treated by adding PAC-1 for 12 h, and then infected with E. piscicida. |
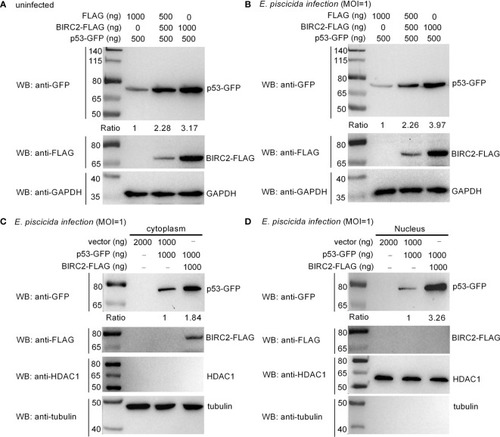
Zebrafish BIRC2 accumulates p53. (A) Zebrafish BIRC2 accumulates p53 in the uninfected EPC cells. (B) Zebrafish BIRC2 accumulates p53 in the E. piscicida-infected EPC cells. (C) Zebrafish BIRC2 accumulates p53 in the cytoplasm of infected EPC cells. (D) Zebrafish BIRC2 accumulates p53 in the nucleus of infected EPC cells. For (A, B), EPC cells transfected with p53-GFP, p3×FLAG and/or BIRC2-FLAG were infected with E. piscicida for 1 h at an MOI of 1 or left untreated. At 6 hpi, the cells were washed, lysed, and subjected to Western Blotting with the indicated antibodies. For (C, D), EPC cells transfected with p53-GFP, p3×FLAG and/or BIRC2-FLAG were infected with E. piscicida for 1 h at an MOI of 1. At 6 hpi, the cells were harvested and used for preparation of nuclear and cytoplasmic extracts. Tubulin and HDAC1 were used as loading controls for cytoplasmic and nuclear protein, respectively. The expression ratio for p53 protein was quantified by Quantity One. |
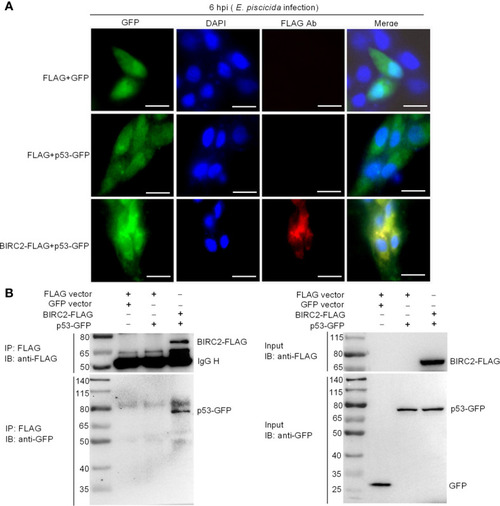
Zebrafish BIRC2 colocalizes and interacts with p53. (A) Immunofluorescence analysis of zebrafish BIRC2 and p53 in EPC cells. EPC cells were transfected with the indicated plasmids and then infected with E. piscicida. At 6 hpi, the infected cells were fixed with 4% formaldehyde for 15 min and subjected to immunofluorescence microscopy assays. Scale bar: 10 μm. (B) The interaction between zebrafish BIRC2 and p53. EPC cells were transfected with the indicated plasmids, then lysed and immunoprecipitated using Anti-FLAG M2-Agarose Affinity Gel beads. The input proteins and precipitates were subjected to Western Blotting using anti-FLAG and anti-pTurboGFP antibodies. |
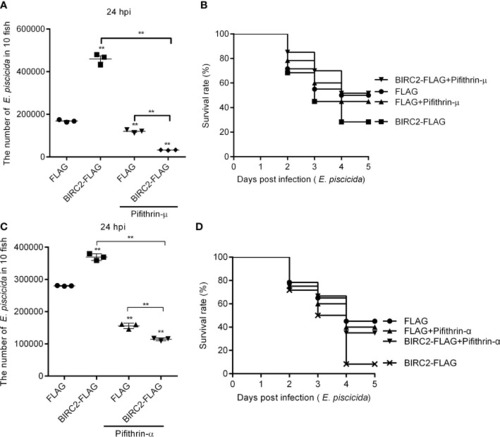
The p53 inactivators block the negative regulation of zebrafish BIRC2 on the E. piscicida infection. (A) Pifithrin-μ inhibited the zebrafish BIRC2-mediated bacterial proliferation at 24 hpi. (B) The effect of Pifithrin-μ on the survival rates of zebrafish larvae microinjected with p3×FLAG or BIRC2-FLAG in the case of E. piscicida infection. (C) Pifithrin-α inhibited the zebrafish BIRC2-mediated bacterial proliferation at 24 hpi. (D) The effect of Pifithrin-α on the survival rates of zebrafish larvae microinjected with p3×FLAG or BIRC2-FLAG in the case of E. piscicida infection. For (A–D), 4 dpf larvae microinjected with the p3×FLAG or BIRC2-FLAG were treated by adding Pifithrin-μ or Pifithrin-α for 12 h, and then infected with E. piscicida. For (A, C), larvae were collected at 24 hpi, and used for colony count. Data represented the means ± the SEM (n = 3) and were tested for statistical significance using a two-tailed student’s t -test. **p < 0.01. The asterisk above the error bars indicates statistical significance using the group microinjected with empty plasmid and without treatment as the control group. The asterisk above the bracket indicates statistical significance between the two groups connected by the bracket. For (B, D), larvae were monitored for 5 days. Exposures were performed in triplicate with 20 larvae per repetition (n = 60). Statistical differences using the log-rank test were observed between the FLAG/BIRC2-FLAG groups (p < 0.05), BIRC2-FLAG/BIRC2-FLAG+ Pifithrin-μ groups (p < 0.01), and BIRC2-FLAG/BIRC2-FLAG+ Pifithrin-α groups (p < 0.01). |