
- Title
-
Attractin Participates in Schizophrenia by Affecting Testosterone Levels
- Authors
- Li, N., Gao, S., Wang, S., He, S., Wang, J., He, L., Jiang, D., Shi, Y.S., Zhang, J., Gu, Y., Chen, T., Kong, M., Xu, X., Zhao, Q.
- Source
- Full text @ Front Cell Dev Biol
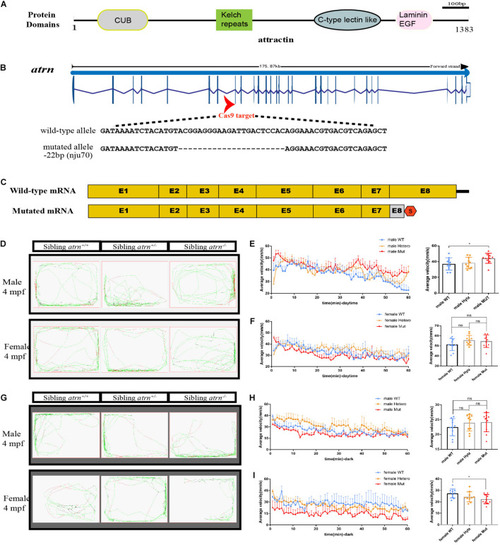
Generation of atrn mutation in zebrafish by CRISPR-Cas9 strategy, and the average velocity of the male mutant is faster than the wild type during the day, but in the dark, the female mutant likes to stay quiet. (A) Zebrafish attractin has the CUB domain, kelch-type beta propeller, C-type lectin-like domain, and laminin EGF domain. (B) Exon 8 is the target for CRISPR/Cas9 gene editing in zebrafish atrn. The CRISPR/Cas9-induced mutation (22-basepair deletion) in atrn is shown in annotated atrn mutant sequences. (C) The mutated atrn mRNA with PTC was predicted to encode truncated protein. (D) Locus diagram of male and female in sibling atrn+, sibling atrn+/–, and sibling atrn–/– groups at 4 mpf during daytime. Average velocity in 1 h was recorded in three genotype groups at 4 mpf. At 10:00–14:00, we analyzed the tracking data of male (E) and female (F) three-genotype groups; the average velocity of the male mutant is faster than the male wild type, but there is no significance among the three female groups. (G) Locus diagram of male and female in sibling atrn+, sibling atrn+/–, and sibling atrn–/– groups at 4 mpf at night. At 00:00–4:00, we analyzed the tracking data of male and female three genotype groups. The average velocity of the female mutant is slower than the male wild type (H), but there is no significance among the three male groups in the night (I). N = 10. Data are shown as mean ± SD; *p < 0.05; **p < 0.01; ***p < 0.001. |
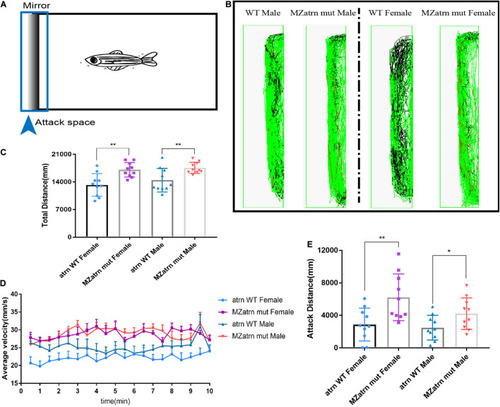
Mirror attack analysis indicated that the aggressive behavior of the atrn–/– adult zebrafish was significantly higher than that of the wild type. (A) Schematic diagram of the experimental design of the mirroring attack. (B) The mirror attack tracking pattern of the wild type (WT) and MZatrn mut with different gender in 10 min. Red: the swimming speed is quicker than 70 mm/s. Green: the swimming speed is between 25 and 70 mm/s. Black: the swimming speed is slower than 25 mm/s. (C) The total tracking distance in whole box space of MZatrn mut is higher than that of the wild type. (D) The velocity–time panel of four groups of zebrafish. (E) The tracking distance in mirror attack space of MZatrn mut is higher than that of the wild type. N = 10. Data are shown as mean ± SD; *p < 0.05; **p < 0.01; ***p < 0.001; ****p < 0.0001; ns, no significance (p > 0.05). |
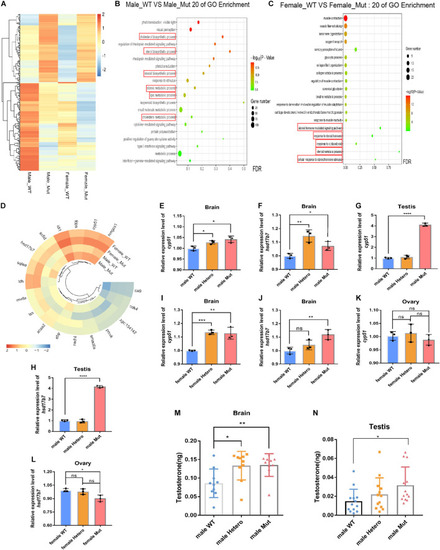
Transcriptome sequencing of the brain in the male and female atrn mutants, and steroid synthesis-related genes are upregulated in the mutant. (A) Heat map shows genes that are differentially expressed in the brain of wild type and mutants of different sexes. N = 3. (B) GO enrichment dot bubble of male wild type and male mutants indicate that GO terms related to steroid synthesis are affected. (C) GO enrichment dot bubble of female WT and female Mut indicate that GO terms related to steroid synthesis are affected. (D) Circular heatmap shows upregulation of genes related to steroid synthesis. qRT-PCR results for cyp51 and hsd17b7 gene expression in the brain (E–J) and testis of WT, heterozygotic (Hetero) and Mut zebrafish at 4 mpf, but there is no expression difference between the brain and ovary of the female adult zebrafish (K,L). N = 9. Testosterone ELISA results show that the content of testosterone in the brain of the male mutant (M) and testis is significantly increased (N). N = 10. Data are shown as mean ± SD; *p < 0.05; **p < 0.01; ***p < 0.001; ****p < 0.0001; ns, no significance (p > 0.05). Heatmap was plotted by http://www.bioinformatics.com.cn, an online platform for data analysis and visualization. |
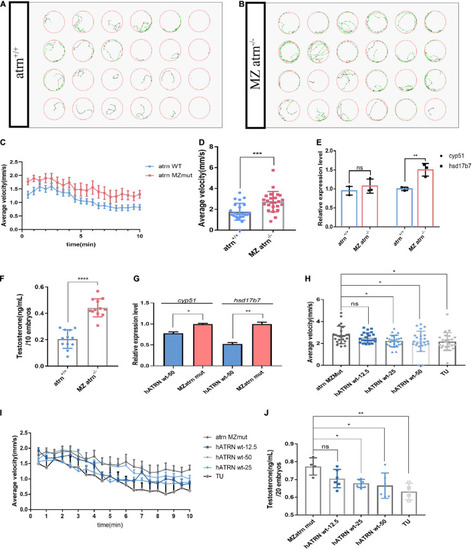
The movements of atrn–/– larvae are faster than the wild type due to higher testosterone concentration at 6 dpf, and human ATRN can rescue the phenotype of zebrafish atrn–/–. (A) The tracking pattern of the wild-type larvae. (B) The tracking pattern of the MZ atrn–/– larvae. (C) Average swimming speed–time graph of atrn WT and MZmut larvae of 144 hpf in 10 min. (D) The average velocity of 24 WT and MZ atrn–/– larvae during 10 min. Error bars, SEM. (E) qRT-PCR results indicate that the expression level of testosterone synthesis key gene hsd17b7 in MZ atrn–/– larvae is increased. (F) Testosterone ELISA assay results show that the content of testosterone in the MZ atrn–/– is also increased. N = 10. (G) qRT-PCR results indicate that the expression level of cyp51 and hsd17b7 in treated MZmut larvae was rescued. (H) Average swimming speed–time graph of 6 dpf larvae injected with hATRN mRNA in 10 min. Error bars, SEM. (I) The average velocity of the control and treated larvae during 10 min. (J) Testosterone ELISA assay results show that the content of testosterone in larvae injected with hATRN mRNA was rescued. N = 20. Data are shown as mean ± SD; *p < 0.05; **p < 0.01; ***p < 0.001; ****p < 0.0001; ns, no significance (p > 0.05). |
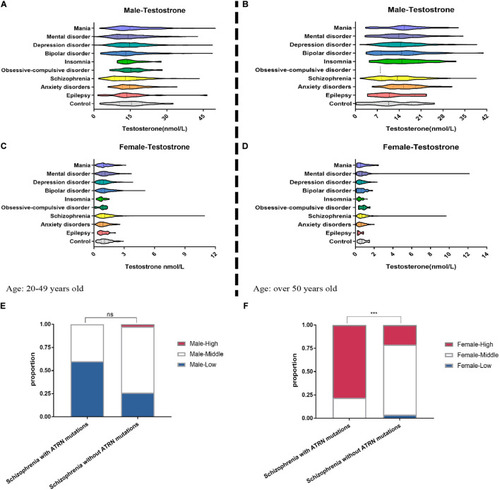
Clinical data show the abnormal serum testosterone level of mental disorder patients. We collected the medical records of patients with mental disorder in the hospital. Among 2,579 male patients (A) and 3,926 female patients (C) aged 20–49 years, the testosterone level in their serum was tested. Among the patients over the age of 50, the proportion of abnormal testosterone levels among 1,009 men (B) suffering from anxiety, insomnia, and depression was significantly increased (E–G), but among 1,741 women (D) suffering from anxiety, insomnia, and depression, the proportion of abnormal testosterone levels is significantly reduced. (E) For five male patients with schizophrenia who are known to have ATRN mutations in the clinic, their lower serum testosterone levels are more than that of schizophrenia patients without ATRN mutations. (F) For nine female schizophrenia patients with ATRN mutations, serum testosterone level was higher than that of the schizophrenia patients without ATRN mutations. Chi-test (Fisher’s exact test). *p < 0.05; **p < 0.01; ***p < 0.001; ns, no significance (p > 0.05). |