
- Title
-
Comparative Antiseizure Analysis of Diverse Natural Coumarin Derivatives in Zebrafish
- Authors
- Kozioł, E., Jóźwiak, K., Budzyńska, B., de Witte, P.A.M., Copmans, D., Skalicka-Woźniak, K.
- Source
- Full text @ Int. J. Mol. Sci.
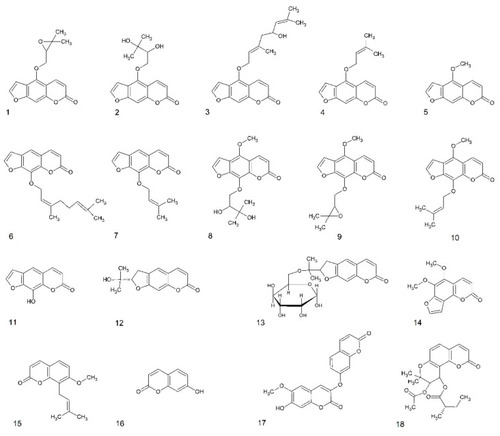
Structures of coumarins used in this study. Furanocoumarins: 1—oxypeucedanin, 2—oxypeucedanin hydrate, 3—notopterol, 4—isoimperatorin, 5—bergapten, 6—8-geranyloxypsoralen, 7—imperatorin, 8—byakangelicin, 9—byakangelicol, 10—phellopterin, 11—xanthotoxol, dihydrofuranocoumarins: 12—nodakenetin, 13—nodakenin; angular furanocoumarin: 14—pimpinellin; simple coumarin derivatives: 15—osthole, 16—umbelliferone, 17—daphnoretin; dihydropyranocoumarin: 18—hyuganin C. |
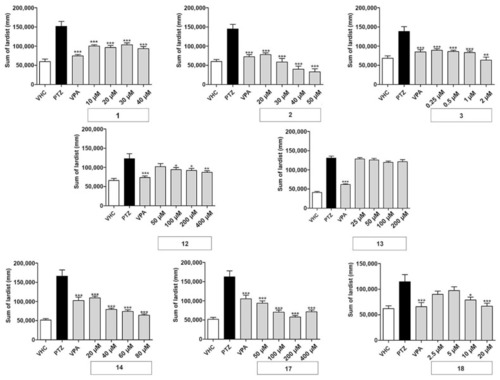
Antiseizure activity based on locomotor analysis of coumarins used in this study. PTZ-induced seizure-like behavior of larvae exposed to vehicle (VHC) only, VHC and pentylenetetrazole (PTZ), positive control valproic acid (VPA) and PTZ, or test compound and PTZ, was expressed as sum of lardist (mm) values during 30 min. Data are shown as the mean ± SEM from three independent experiments, with n = 10 for each experiment (n = 30 in total). Statistical analysis: one-way ANOVA with Dunnett’s multiple comparisons test (GraphPad Prism 5). Significance levels: * p < 0.05; ** p < 0.01; *** p < 0.001. |
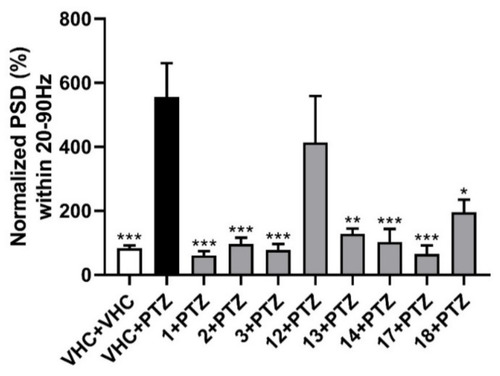
Electrophysiological antiseizure analysis of coumarins used in this study. Non-invasive local field potential recordings from the optic tectum of larvae pre-exposed to vehicle (VHC) only, VHC and pentylenetetrazole (PTZ), or test compound and PTZ. Normalized power spectral density (PSD) in defined frequency band of 20–90 Hz per individual larva is shown (mean ± SEM). Number of replicates: n = 9–10 for each compound group and n = 29–30 for the VHC + VHC and VHC + PTZ controls. Statistical analysis: one-way ANOVA with Dunnett’s multiple comparisons test (GraphPad Prism 7). Significance levels: * p < 0.05; ** p < 0.01; *** p < 0.001. |

Lowest energy poses of (A) oxypeucedanin hydrate (2) and (B) byacangelicin (8) docked to a structural model of GABA-transaminase cocrystalized with pyridoxal 5′-phosphate (1OHV.pdb). Docked molecules are rendered in stick mode with atom color coded style; protein molecule is rendered in secondary structure mode (gray) and only the residues found essential for interaction with docked molecules are explicitly visualized in the stick model (discussed hydrogen bonds shown as green arrows). Pyridoxal 5′-phosphate cofactor molecule is shown in ball mode and colored in magenta. All aliphatic hydrogen atoms are hidden for clarity. Figures prepared in YASARA 19.5.23. |