
- Title
-
The LAMMER Kinase, LkhA, Affects Aspergillus fumigatus Pathogenicity by Modulating Reproduction and Biosynthesis of Cell Wall PAMPs
- Authors
- Lim, J.Y., Kim, Y.J., Woo, S.A., Jeong, J.W., Lee, Y.R., Kim, C.H., Park, H.M.
- Source
- Full text @ Front Cell Infect Microbiol
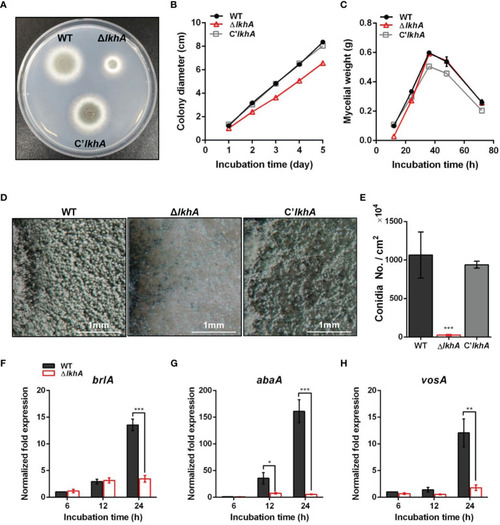
Vegetative growth and asexual development of ΔAflkhA strain. (A) Colony morphology of WT, ΔAflkhA, and C’AflkhA strains. Spores were inoculated onto GMM agar and incubated at 37°C for two days. (B) Radial growth of WT, ΔAflkhA, and C’AflkhA strains. Colony diameter of each strain was measured daily from point of inoculation over five days. When error bars are not shown, they are smaller than symbols (n = 5). (C) Mycelial production on liquid YCGMM. Dry weight of each strain was measured. When error bars are not shown, they are smaller than symbols (n = 3). (D) Conidiophore heads on GMM agar. (E) Quantification of conidia production (n = 4). *P < 0.05. (F-H) Expression patterns of brlA (F), abaA (G) and vosA (H) genes. Mycelial balls of strains obtained from YCGMM liquid culture were transferred to GMM agar and incubated for indicated hrs. Total RNA was extracted and RT-qPCR analysis was performed using 18S rRNA gene as an internal control. **P < 0.01, ***P < 0.001. |
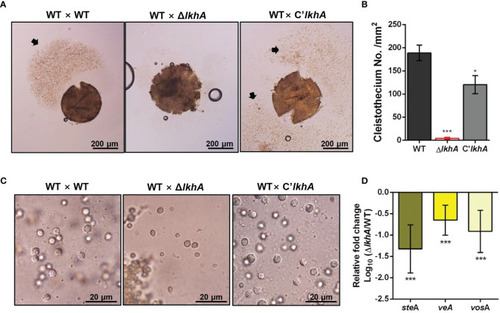
Role of AfLkhA in sexual development. (A) Morphology of the sexual fruiting body, cleistothecium, in WT, ΔAflkhA, and C’AflkhA strains. Mycelial balls were moved to oatmeal agar and incubated at 30°C for 14 days under dark conditions to induce sexual development. Arrow indicates a cloud of ascospores sprayed from cleistothecium. (B) Quantification of cleistothecia production (n = 5). Asterisk represents significant differences: *P < 0.05, ***P < 0.001. (C) Morphology of ascospores. Cleistothecium was ruptured on a glass slide to observe ascospores. (D) Relative expression patterns of steA, veA and vosA. Total RNA was extracted from cleistothecia. RT-qPCR analysis was performed using 18S rRNA gene as an internal control. The x-axis shows a list of genes. The y-axis indicate the relative mRNA abundance of the genes in ΔAflkhA strain compared to WT. The values were transformed and presented as Log10. ***P < 0.001. |
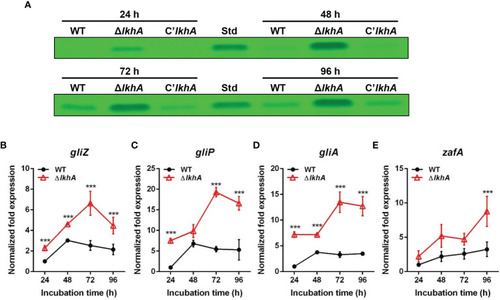
Role of AfLkhA in gliotoxin production. (A) Determination of GT production in WT, ΔAflkhA, and C’AflkhA strains. GT were extracted with chloroform from culture supernatant of each strain and subjected to TLC. Std: GT standard (Simga-Aldrich). (B–E) Total RNA was extracted from mycelial balls incubated in Czapek Dox broth. RT-qPCR analysis was performed using 18S rRNA gene as an internal control. Expression patterns of GT cluster genes, transcription factor gliZ (B), nonribosomal peptide synthetase gliP (C), transporter gliA (D), and transcriptional activator zafA (E). ***P < 0.001. |
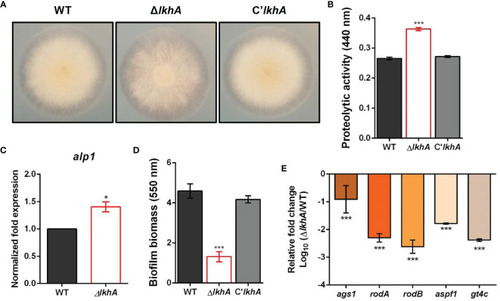
Roles of AfLkhA in protease production and biofilm formation. (A) Halo formed at edge of colonies of WT, ΔAflkhA, and C’AflkhA strains. Each strains were point-inoculated on Czapek Dox medium containing 1% skim milk and incubated at 30°C. (B) Quantification of proteolytic activity. Supernatants were obtained from Czapek Dox broth (pH 7.3) containing 1% skim milk powder for 3 days at 30°C. Protein concentrations were calculated with a BCA Protein Assay Kit. Protease activity was measured using an azocasein assay. The experiments included six replicates (n = 6). ***P < 0.001. (C) Expression pattern of alkaline protease alp1 gene. Total RNA was extracted from mycelial balls incubated in Czapek Dox broth. RT-qPCR analysis was performed using 18S rRNA gene as an internal control. *P < 0.05. (D) Crystal violet staining assay. Biofilm formation was measured after 16 hrs of growth in GMM. The biofilms were stained with 0.01% crystal violet and dissolved in 30% acetic acid solution. The amounts of dye were measured by spectrophotometry at 550 nm (n = 10). ***P < 0.001. (E) Relative expression patterns of α-1,3-glucan synthase (ags1), hydrophobins rodA, rodB, a ribonuclease (aspf1), and a GAG synthase (gt4c). Total RNA was extracted from biofilm cultures. RT-qPCR analysis was performed using 18S rRNA gene as an internal control. The x-axis shows a list of genes. The y-axis indicate the relative mRNA abundance of the genes in ΔAflkhA strain compared to WT. The values were transformed and presented as Log10. ***P < 0.001. |
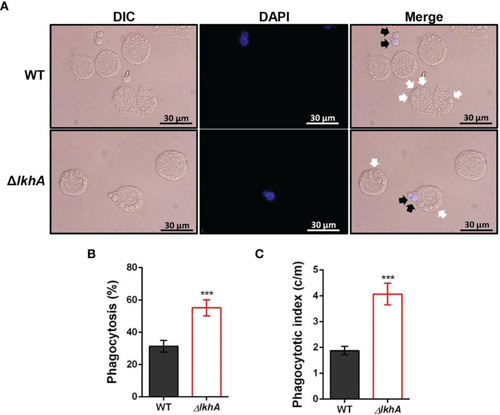
Alveolar macrophage response to ΔAflkhA conidia. MH-S murine alveolar macrophages were challenged with a three-fold concentration of WT and ΔAflkhA conidia and then incubated for 4 hrs at 37°C in an atmosphere of 5% CO2. (A) Microscopic analysis of the uptake of the fungal conidia by MH-S macrophages. External conidia (black arrows) were stained by calcofluor white (1 μg/mL in DPBS). White arrows indicate conidia endocytosed by macrophage cells. (B) Phagocytosis of conidia. The percentage of macrophages containing more than one ingested conidia was counted (n = 18). (C) Phagocytosis index. The average number of indigested conidia per macrophage (c/m) was calculated (n = 40). Statistical analysis was performed using the student’s t-test. ***P < 0.001. |
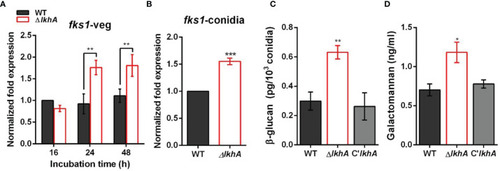
Role of AflkhA in biosynthesis of conidial cell walls. Expression level of β-1,3-glucan synthase fks1 in vegetative cells (A) and conidia (B). Spores were inoculated in MM liquid culture and incubated for the indicated number of hrs. Total RNA was extracted and RT-qPCR analysis was performed using 18S rRNA gene as an internal control. **P < 0.01, ***P < 0.001. (C) Amount of β-glucan (pg) per 103 conidia in WT and ΔAflkhA strains (n = 4). **P < 0.01 (D) Concentration (ng/mL) of GM. Conidia was inoculated in modified Brian medium and cultured at 37°C for 24 hrs. Extracellular GM content in the culture supernatant was assayed by ELISA (n = 4). *P < 0.05. |
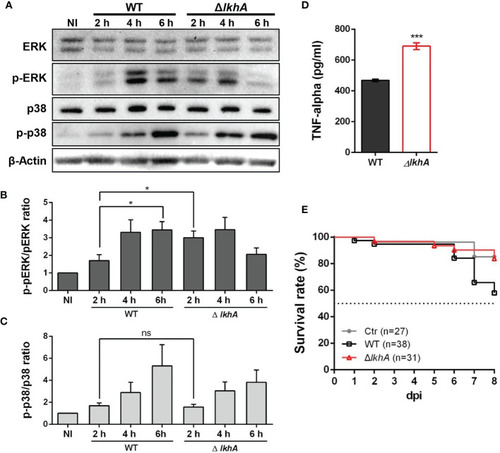
Effect of MAPK phosphorylation and cytokine release from alveolar macrophages treated with AflkhA-null conidia. MH-S cells were simulated with 10-fold of WT and ΔAflkhA conidia and then incubated for the indicated time points. (A) Phosphorylation of ERK and p38 after stimulation of MH-S cells with conidia was analyzed by western blotting. The level of phosphorylation was quantified after normalization to the levels of total ERK (B) or p38 (C) using ImageJ software. *P < 0.05. ns, not significant. (D) Release of TNF-α. MH-S cells were challenged with 10-fold WT and ΔAflkhA conidia. The release of TNF-α was measured by ELISA 6 hrs after infection. ***P < 0.001. (E) Virulence of A. fumigatus ΔAflkhA in T cell-deficient zebrafish larvae (foxn1 morphant). Conidia diluted in fluorescence dye were injected at 3 dpf (0 dpi). Survival was monitored at > 8 dpi. Ctr represents the control. Data are mean values. PHENOTYPE:
|
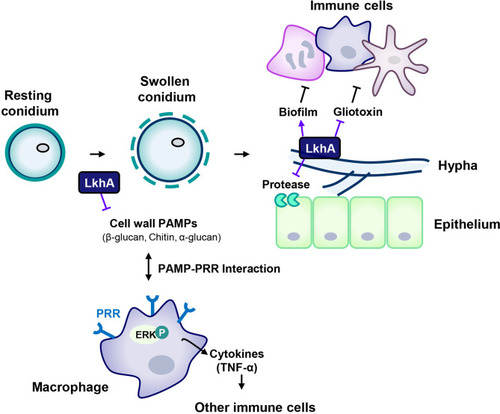
Proposed model for the involvement of LAMMER kinase in the interaction between A. fumigatus and immune cells. The composition of the cell wall continuously changes during the life cycle of A. fumigatus. The resting conidia first come into contact with host epithelial cells. When conidia swell, the outer layer (melanin and hydrophobins) is removed, uncovering the inner cell wall, which is mainly composed of glucan, chitin, and GM. LkhA regulates the transcription of genes for cell wall components and hydrophobins, which affects PAMP-PRR interactions in alveolar macrophages. This interaction mediates ERK signaling and stimulates the production of the proinflammatory cytokine TNF-α, which can promote the activation and proliferation of T cells. Hyphae differ in cell wall composition. The cell wall molecule GAG is secreted from hyphae and is present in the biofilm. The adhesion ability of A. fumigatus to the cell surface is important for virulence. LkhA is required for biofilm formation by modulating gene expression. During its growth, A. fumigatus produces GT, which is toxic to host cells. LkhA represses the expression of GT clustered genes and thus the production of GT. A. fumigatus also produces proteases to obtain nutrients by degrading macromolecules in the host environment. LkhA negatively regulates the expression of gene(s) for alkaline proteases and thus protease production. The virulence of A. fumigatus in the T cell-deficient zebrafish larva model was reduced by the loss of lkhA. |