
- Title
-
Progranulin A Promotes Compensatory Hepatocyte Proliferation via HGF/c-Met Signaling after Partial Hepatectomy in Zebrafish
- Authors
- Chiang, K.Y., Li, Y.W., Li, Y.H., Huang, S.J., Wu, C.L., Gong, H.Y., Wu, J.L.
- Source
- Full text @ Int. J. Mol. Sci.
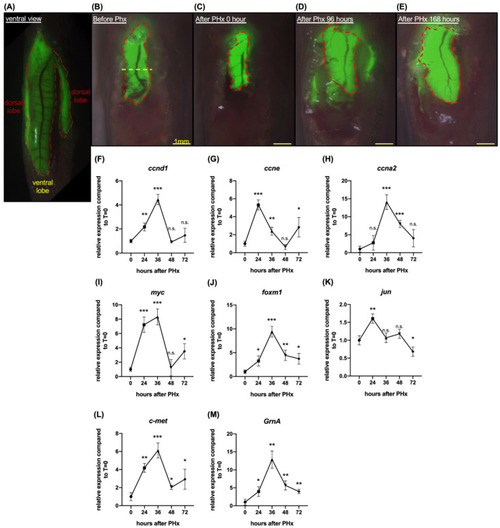
Liver regeneration was induced by one-half ventral lobe partial hepatectomy in 7 days. (A) Ventral view of Tg(fabp10:EGFP). The green fluorescent area marked by the red dotted line is the liver of Tg(fabp10:EGFP). (B) Schematic diagram of one-half ventral lobe partial hepatectomy (PHx). The regenerating ventral lobe is shown at 0 h (C), 96 h (D), and 168 h (E) after PHx. Area marked by the red dotted line is the liver ventral lobe. Yellow dotted line, the site of PHx. Scale bar: 1 mm. Gene expression was examined by quantitative PCR. Cell cycle regulatory genes included (F) ccnd1, (G) ccne, and (H) ccna2. Cell proliferation-associated genes included (I) myc, (J) foxm1, and (K) jun. (L) Gene expression of c-met. (M) Gene expression of GrnA. The relative expression levels compared to control at 0 h PHx are presented as mean ± SD. Significance was set at * p < 0.05, ** p < 0.01, *** p < 0.001, as determined by t-test; PHx, partial hepatectomy. |
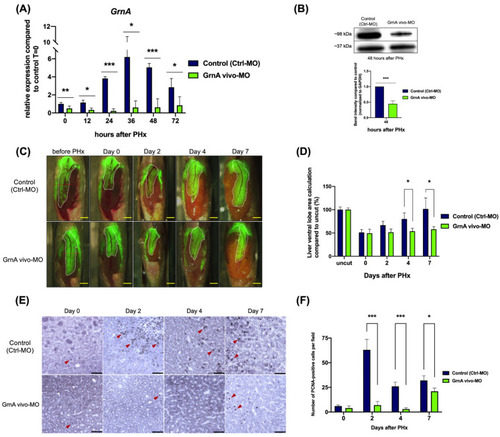
GrnA morphant exhibited impaired liver regeneration after PHx. (A) GrnA gene expression was examined by quantitative PCR after PHx. The relative expression levels are presented as mean ± SD, compared to control group at 0 h PHx. (B) Protein levels of GrnA and GAPDH were examined by Western blot analysis at 2 days after PHx. GrnA protein levels were normalized to GAPDH and then fold-change was calculated compared to control group. The values are presented as mean ± SD. (C) Partial hepatectomy in control (upper) and GrnA morphant (lower) was carried out on day 0. The regenerating liver ventral lobe is shown at 2, 4, and 7 days after PHx. White dotted line indicates liver ventral lobe. Red dotted line shows the site of PHx. Scale bar: 1 mm. (D) Liver ventral lobe area after PHx is shown in (C). The area was normalized to control uncut group and presented as percentage; mean ± SD. (E) Immunohistochemical staining of PCNA in liver ventral lobe at 0, 2, 4, and 7 days after PHx. Red arrowhead indicates the PCNA-positive cells. Scale bar: 50 μm. (F) Number of PCNA-positive cells was quantified after PHx, as shown in (E). The data are presented as mean ± SD. Significance was set at * p < 0.05, ** p < 0.01, *** p < 0.001, as determined by t-test; PHx, partial hepatectomy. |
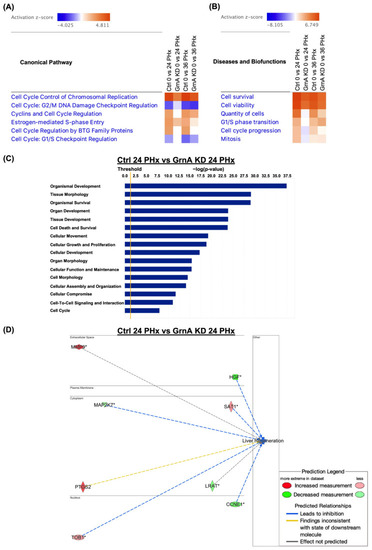
Canonical pathway, and functional and gene interaction network analyses of control and GrnA Mo-treated animals at 0, 24, and 36 h after PHx. (A) Heatmap shows canonical pathway analysis in comparison to control and GrnA Mo treatments at 24 and 36 h after PHx versus 0 h after PHx. (B) The heatmap shows disease and biofunctional analyses of control and GrnA Mo treatment at 24 and 36 h after PHx versus 0 h after PHx. Activation z-score indicates activation states of upstream transcriptional regulators: “activated” (orange) or “inhibited” (blue). Significantly activated or inhibited indicates an overlap p-value ≤ 0.05 and an z-score ≥ 1.5 (or ≤−1.5). (C) The top ranked diseases and biofunctions in control Mo versus GrnA Mo treatment at 24 h PHx. The threshold line represents a p-value of 0.05. (D) The gene interaction network was predicted for liver regeneration. The lines represent direct or indirect gene-to-gene interactions, and the color represents fold change. The pathway, functional analyses, and network analyses were generated using IPA. * more than one ID linked to this gene. |
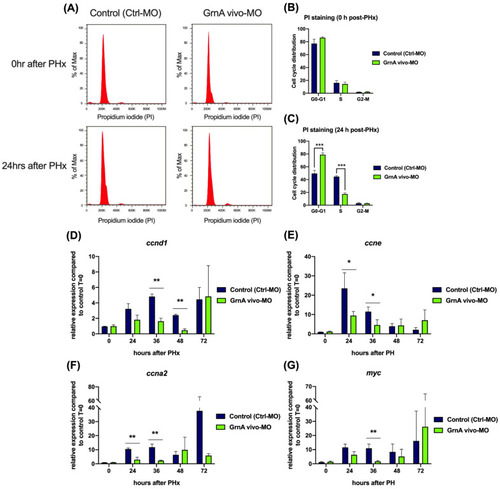
Cell cycle progression and cell proliferation were suppressed in GrnA morphants after PHx. (A) Cell cycle analysis of hepatectomized control and GrnA morphant zebrafish for 0 h (upper) and 24 h (lower) after PHx. PI staining was performed, and samples were analyzed using flow cytometry. The proportion of cells at each stage at 0 h (B) and 24 h (C) after PHx was analyzed by Flow-Jo software and is presented as mean ± SD. The cell cycle regulatory genes included (D) ccnd1, (E) ccne, and (F) ccna2, and (G) myc, the cell proliferation related gene, was probed by quantitative PCR. Data are shown as relative expression of indicated genes normalized to control 0 h after PHx. EF1a served as the internal control. Significance was set at * p < 0.05, ** p < 0.01, *** p < 0.001, as determined by t-test; PHx, partial hepatectomy. |
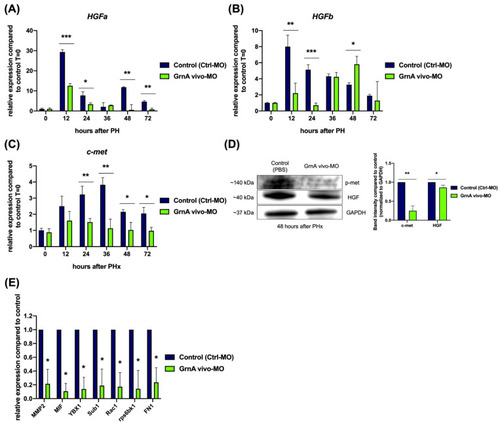
Knockdown of GrnA decreased the expression of HGF/c-met axis in hepatectomized zebrafish. Quantitative PCR analysis of zebrafish HGF paralogs, (A) HGFa and (B) HGFb, as well as the HGF-specific receptor, (C) c-met, in control and GrnA morphant zebrafish after PHx. The relative expression levels compared to control group at 0 h after PHx are presented as mean ± SD. EF1a served as the internal control. (D) Protein levels of p-met, HGF, and GAPDH were examined by Western blot analysis at 48 h after PHx. The levels of p-met and HGF proteins were normalized to GAPDH protein levels and then compared to control group. The fold change compared to controls is presented as mean ± SD. (E) Quantitative PCR analysis of c-met upstream signaling-related genes, including MMP2, MIF, and YBX1, and c-met downstream signaling-related genes, including Sub1, Rac1, rps6kb1, and Fn1. The relative expression levels compared to control group are presented as mean ± SD. EF1a served as the internal control. Significance was set at * p < 0.05, ** p < 0.01, *** p < 0.001, as determined by t-test; PHx, partial hepatectomy; p-met, phospho-met. |
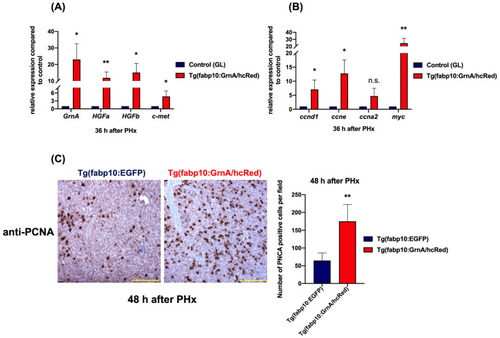
Liver-specific overexpression of GrnA positively regulated the HGF/c-met axis in hepatectomized zebrafish. (A) Quantitative PCR analysis of zebrafish GrnA, HGFa, HGFb, and c-met in hepatectomized zebrafish at 36 h after PHx. (B) The cell cycle regulatory genes (ccnd1, ccne, and ccna2) and cell proliferation-associated gene, myc, were examined by quantitative PCR. The relative expression levels compared to control group are presented as mean ± SD. EF1a served as the internal control. (C) Immunohistochemistry staining of PCNA in liver ventral lobe at 48 h after PHx. Scale bar: 50 μm. Number of PCNA-positive cells was quantified using ImageJ. The data are presented as mean ± SD. Significance was set at * p < 0.05, ** p < 0.01, as determined by t-test; PHx, partial hepatectomy; GL, green liver transgenic line. |