
- Title
-
SLC1A1 mediated glutamine addiction and contributed to natural killer T-cell lymphoma progression with immunotherapeutic potential
- Authors
- Xiong, J., Wang, N., Zhong, H.J., Cui, B.W., Cheng, S., Sun, R., Chen, J.Y., Xu, P.P., Cai, G., Wang, L., Sun, X.J., Huang, J.Y., Zhao, W.L.
- Source
- Full text @ EBioMedicine

Metabolomic assay indicated aberrant glutamine metabolism in patients with NKTCL. (a) Distinguished serum metabolites of NKTCL (red dots), PTCL (dark blue dots), and DLBCL (light blue dots), comparing with healthy volunteer, were overlaid on human metabolic reference map (KEGG: hsa01100) using Interactive Pathways Explorer v3 (iPath 3). Pathways involving amino acid metabolism (yellow lines), nucleotide metabolism (red lines), carbohydrate metabolism (purple lines) and lipid metabolism (green lines) were highlighted. (b) Distinguished serum metabolites of NKTCL, PTCL and DLBCL, comparing with healthy volunteer, were categorized into 4 subtypes according to their relevance to amino acid, nucleotide, carbohydrate, or lipid metabolism. (c) KEGG metabolic pathway enrichment by ConsensusPathDB using distinguished serum metabolites of NKTCL, comparing with healthy volunteer. (d) Standard amino acids significantly altered in NKTCL, comparing with healthy volunteer. |

SLC1A1 enhanced glutamine uptake and was highly expressed in patients with NKTCL. (a) LASSO regression analysis in 10-fold cross-validation was performed with selected metabolites (glutamate, glutamine, and aspartate). Two dotted vertical lines marked the lambda at minimum and 1-s.e. mean-squared error, respectively. (b) LASSO coefficient profiles of 26 SLC-family genes. A vertical line indicated the value of lambda at minimum mean-squared error. (c) Tumor EAAT3 expression detected by immunohistochemistry. (d) Quantification of targeted amino acids (arranged by P values from left to right) in serum samples of NKTCL patients (n=88) according to tumor EAAT3 expression. (e) Quantification of targeted amino acids (arranged by P values from left to right) in cytoplasm samples of NK-92 cells transfected with SLC1A1 vector or control vector. (f) Tumor EAAT3 expression correlated with its mRNA levels in NKTCL patients (n=100). (g) Correlation of tumor SLC1A1 mRNA expression with serum glutamine levels in NKTCL patients (n=102). Assays in (e) were set up in 6 replicated. Data in (d), (e) and (f) were represented as mean ±SD. P values in (c) were calculated by Pearson's chi-square test. P values in (d), (e) and (f) were calculated with unpaired t-test. P value in (g) was calculated by Pearson correlation test. |
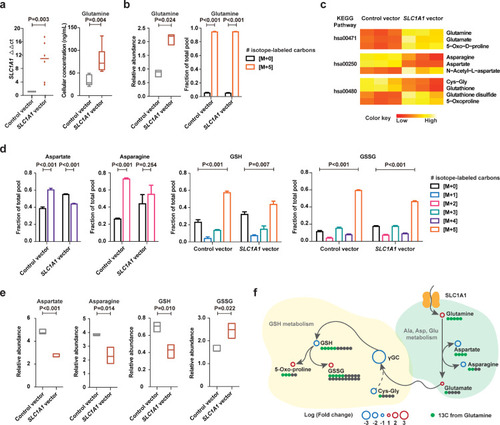
Increased glutamine uptake mediated by SLC1A1 enhanced glutathione metabolic flux. (a) SLC1A1 mRNA expression (left panel) and cellular glutamine levels (right panel) in NK-92 cells transfected with SLC1A1 vector or control vector. The control vector values of SLC1A1 mRNA expression were normalized to 1. (b) Relative abundance (left panel) and isotope-labeled fraction (right panel) of glutamine in NK-92 cells transfected with SLC1A1 vector or control vector. (c) Heatmaps of isotope-labeled metabolites significantly altered in NK-92 cells transfected with SLC1A1 vector, comparing with control vector. The aberrant metabolites were enriched into the KEGG pathways indicated at left: hsa00471, D-glutamine and D-glutamate metabolism; hsa00250, alanine, aspartate and glutamate metabolism; hsa00480, glutathione metabolism. (d and e) The isotope-labeled fraction (d) and relative abundance (e) of aspartate, asparagine, GSH, and GSSG in NK-92 cells transfected with SLC1A1 vector or control vector. (f) A schematic to show the metabolic flux of isotope-labeled glutamine. Assays in (a, right panel) were set up in 6 replications. Assays in (b), (d) and (e) were set up in triplicate. Data in (a), (b), (d) and (e) were represented as mean ±SD. P values in (a), (b), (d) and (d) were calculated with unpaired t-test. |

SLC1A1-mediated glutamine addition and malignant phenotype in NKTCL. (a, b, and c) SLC1A1 expression (a), cell proliferation (b) and colony formation (c) of NK-92 cells transfected with SLC1A1 vector or control vector and SNK-6 cells transfected with SLC1A1 shRNA or scramble. (d) Cell viability of NK-92 cells transfected with SLC1A1 vector or control vector under glutamine-depleted medium. (e and f) Cell growth inhibition (e) and colony formation (f) of NK-92 cells transfected with SLC1A1 vector under indicated culture medium. (g) IC50 of NK-92 cells transfected with SLC1A1 vector or control vector and SNK-6 cells transfected with SLC1A1 shRNA or scramble treated with asparaginase. (h) Tumor formation of NK-92 cells transfected with SLC1A1 vector or control vector under indicated number of injected cells in xenograft zebrafish models. (i) Survival of xenograft zebrafish models injected with NK-92 cells transfected with SLC1A1 vector or control vector upon asparaginase treatment (0.5 IU/mL). All the assays were set up in triplicate. Data in (a), (b), (c), (d), (e), (f), (g) and (h) were represented as mean ± SD. P values in (a), (b), (c), (d), (e), (f), (g) and (h)were calculated with unpaired t-test. P values in (i) were calculated with log-rank test. |

Asparaginase treatment increased NKTCL cell sensitivity to anti-PD-1 antibody. (a) SLC1A1 expression on NK-92 cells transfected with SLC1A1 vector or control vector (upper panel) and SNK-6 cells transfected with SLC1A1 shRNA or scramble (lower panel). (b) Ki-67 and TIM-3 positivity of CD3+/CD8+ T cells in PBMC co-cultured with NK-92 cells (upper panel) or SNK-6 cells (lower panel) transfected with indicated vectors or shRNAs in medium with or without extra glutamine (2mM). (c) PD-L1 mRNA expression in NK-92 cells transfected with SLC1A1 vector or control vector (upper panel) and SNK-6 cells transfected with SLC1A1 shRNA or scramble (lower panel) upon asparaginase (10 IU/mL) treatment. The control vector or scramble values were normalized to 1, respectively. (d and e) Median fluorescence intensity of PD-L1 (d) on NK-92 cells (upper panel) or SNK-6 cells (lower panel), as well as Ki-67 and TIM-3 positivity of CD3+/CD8+ T cells in PBMC co-cultured with NK-92 cells (upper panel) or SNK-6 cells (lower panel) upon indicated treatment. (f) Gene expression correlation of tumor SLC1A1 with PD-L1 in NKTCL patients (n=128). (g) Tumor EAAT3 expression according to the TSIM, HEA, and MB subtypes in NKTCL patients (n=100). (h) PD-L1 mRNA expression of NK-92 cells transfected with TP53 R248Q, TP53 R273H, EP300 vector, or MGA shRNA upon indicated treatment. (i) Ki-67 positivity of CD3+/CD8+ T cells in PBMC co-cultured with NK-92 cells transfected with TP53 R248Q, TP53 R273H, EP300 vector, or MGA shRNA upon indicated treatment. Assays in (a), (b), (c), (d), (e), (h), and (i) were set up in triplicate. Data in (a), (b), (c), (d), (e), (h), and (i) were represented as mean ± SD. P values in in (a), (b), (c), (d), (e), (h), and (i) were calculated with unpaired t-test. P value in (f) was calculated with Pearson correlation test. P values in (g) were calculated by Pearson's chi-square test. |
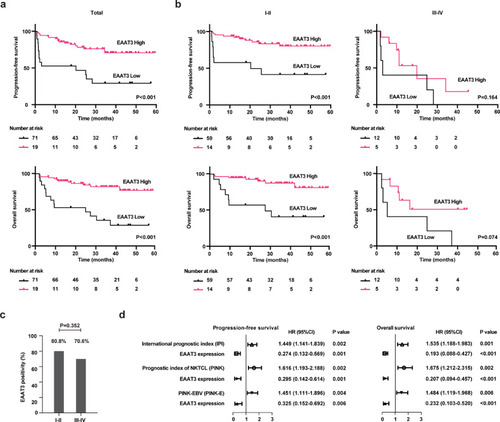
Clinical outcome according to EAAT3 expression in patients with NKTCL. (a and b) Progression-free survival (PFS, upper panel) and overall survival (OS, lower panel) according to tumor EAAT3 expression in all the patients (a), and stage I-II or III-IV patients (b) treated with asparaginase-based regimens. (c) Tumor EAAT3 expression in stage I-II or III-IV patients. (d) Multivariate analysis of predictors indicated on the left (EAAT3 and IPI, EAAT3 and PINK, or EAAT3 and PINK-E) for PFS and OS in NKTCL. Hazard ratio (HR), 95% confidence interval (95% CI) and P value were indicated on the right of each forest plot. P values in (a) and (b) were calculated with log-rank test. P value in (c) was calculated with Pearson's chi-square test. P values in (d) was calculated with Cox proportional hazards models. |