FIGURE SUMMARY
Title

The importance of individual variation for the interpretation of behavioural studies: ethanol effects vary with basal activity level in zebrafish larvae

Authors
Davis, R., Luchtenburg, F., Richardson, M., Schaaf, M., Tudorache, C., Slabbekoorn, H.
Source
Full text @ Psychpharma

Overview of the two behavioural tests. a Individual consistency: schematic representation of the activity test (above), using a 48-well plate, recorded with a top camera view inside the ZebraBox, alongside the three times repeated protocol time line on three subsequent days: 6 dpf, 7 dpf, and 8 dpf; and the emergence test (below): each day, the activity test was followed by an emergence test with the same individual. Three times, we assessed the time it took an individual to emerge. b Ethanol test: after an acclimation phase, followed by a 1-h basal phase with lights on, a sudden dark challenge would trigger an acute increase in swimming velocity. The dark phase (4 min) was divided into a startle phase (first second) and a post-startle phase (last 3 min). This test was also performed with a 48-well plate with a top-view camera in the ZebraBox, twice per day: the first test was done in pre-exposure condition of egg water, followed by a 20-min exposure period and a second test under exposure conditions of a non-lethal 1% ethanol solution

Results of the consistency tests. a Swimming velocity (V, mm s−1) of individual zebrafish larvae at 6 dpf of age compared to their swimming velocity at 7 dpf. b V of the same individual zebrafish larvae at 7 dpf of age compared to their swimming velocity at 8 dpf. (Spearman rank test). A line indicates a significant correlation (p < 0.05). V as a behavioural trait is consistent over time. c Emergence time (ET, s) of individual zebrafish larvae at 6 dpf of age compared to their swimming velocity at 7 dpf. d ET of the same individual zebrafish larvae at 7 dpf of age compared to their swimming velocity at 8 dpf (Spearman rank test). A line indicates a significant correlation (p < 0.05). ET as a behavioural trait is consistent over time only between 7 and 8 dpf

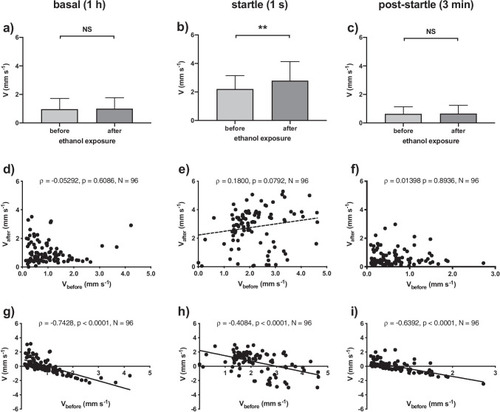
Results of the ethanol test. Swimming velocity (V, mm s−1) of zebrafish larvae at 6 dpf, before and after exposure to a non-lethal 1% ethanol solution in egg water. We depicted basal, startle, and post-startle phase data, respectively. ac When considering the entire population, swimming velocity was significantly different between pre-exposure and exposure conditions only during the startle phase (b; Wilcoxon paired-signed rank test; ** p < 0.01, NS p > 0.05, N = 96), but not during basal (a) and post-startle phase (c). df There were no significant correlations between individual velocities in pre-exposure and exposure conditions for any of the phases (Spearman rank test). A dotted line indicates a non-significant trend (0.05 < p < 0.1). The consistency of inter-individual variation across days, as found in the first test, was not found within an hour in the context of ethanol exposure in this second test. gi Activity level dependent individual variation in response yielded a significantly negative correlation between V and ΔV in all three of the phases (Spearman rank test). A line indicates a significant correlation (p < 0.05)

Acknowledgments
This image is the copyrighted work of the attributed author or publisher, and ZFIN has permission only to display this image to its users. Additional permissions should be obtained from the applicable author or publisher of the image. Full text @ Psychpharma