
- Title
-
Probiotic Administration Mitigates Bisphenol A Reproductive Toxicity in Zebrafish
- Authors
- Giommi, C., Habibi, H.R., Candelma, M., Carnevali, O., Maradonna, F.
- Source
- Full text @ Int. J. Mol. Sci.
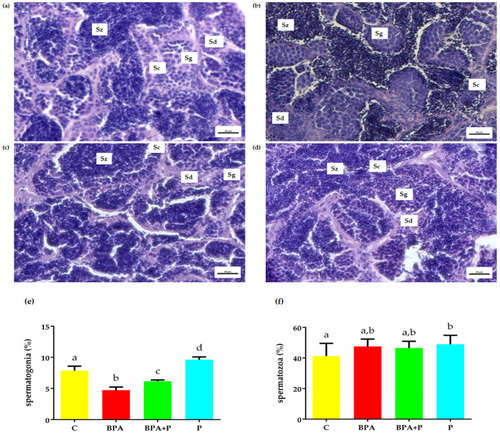
Histological sections of testis: C (a), BPA (b), BPA+P (c), and P (d). Eosin-Mayer’s haematoxylin staining. Sg: spermatogonia; Sc: spermatocyte; Sd: spermatid; Sz: spermatozoa. Scale bar: 20 µm. Percentage of zebrafish testicular area occupied by spermatogonia (e) and spermatozoa (f). Data reported as means ± SEM. Different letters denote statistically significant differences among experimental groups (one-way ANOVA, p < 0.05, Dunnett’s multiple comparison test). |
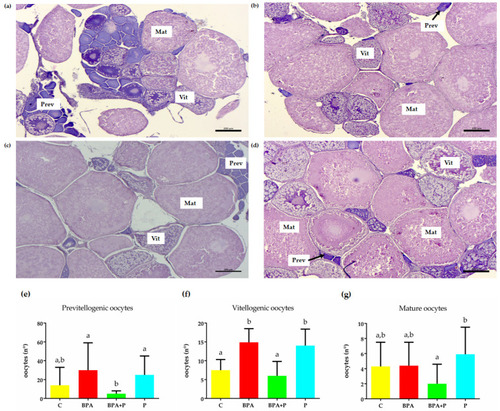
Histological analysis of ovaries from C (a), BPA (b), BPA+P (c) and P (d). Ovarian sections show different follicular stages. Eosin and Mayer’s haematoxylin staining. Prev: previtellogenic oocytes; Vit: Vitellogenic oocytes; Mat: mature oocytes. Scale bar: 200 µm. Percentage of different follicle classes (e–g). Data are reported as mean ± SEM. Different letters denote statistically significant differences among experimental groups (one-way ANOVA, p < 0.05, Dunnett’s multiple comparison test). |

Scores plot and biplot of testis (a,b), class III (c,d) and class IV (e,f) follicles of mRNA levels data obtained in C (red), BPA (green), BPA+P (blue) and P (light blue) groups. (a,c,e) Axes show scores on PC1 and PC2; (b,d,f) bottom and left axes show scores on PC1 and PC2, top and right axes show loadings; red arrows show variable loadings. |