Cisplatin-induced apoptosis and proliferation in HeLa cells. (A) Proliferation kinetics of HeLa cells. HeLa cells were treated with a range of cisplatin concentrations for 16 h and the proliferation rate was measured by WST-1 assay. (B) Percentage of live and early apoptotic population of HeLa cells. Hela cells were treated with 80 μM cisplatin (CP) for 16 h and the rate of apoptotic cells were determined by Annexin-V and 7AAD staining. The stained cells were analyzed by flow cytometry. DMSO (0.1%) was used as negative control. (C,D) The population distributions of DMSO control and CP-treated groups as flow cytometry dot blot graphs, respectively. ns, non-significant, p > 0.05, p ≤ 0.05, ∗∗p ≤ 0.01, ∗∗∗p ≤ 0.001, and ****p ≤ 0.0001.

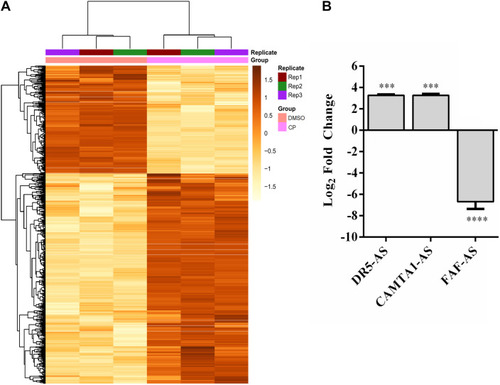
Differentially expressed lncRNAs in cisplatin-treated HeLa cells. (A) Heatmap of top 1,000 differentially expressed transcripts in cisplatin- and DMSO-treated HeLa cells. HeLa cells were treated with cisplatin as explained in Figure 1B. (B) qPCR analyses of candidate lncRNAs. qPCR was carried out with total RNAs isolated from control (0.1% DMSO) and cisplatin-treated HeLa cells. Relative expression of candidate genes was normalized against GAPDH. ∗∗∗p ≤ 0.001, ****p ≤ 0.0001.

Genomic location of DR5-AS and its expression in cisplatin-treated HeLa cells. (A) Schematic representation of DR5-AS (ENSG00000246130) and interference with DR5 transcript variant combined with the Ensembl structure. (B–D) qPCR analysis of DR5-AS expression in untreated cells (B, normalized to DR5-AS expression in HeLa cells), cisplatin-treated cells (C, normalized to DR5-AS expression in DMSO-treated cells), and fractionated cells (D). Cisplatin treatment and qPCR analyses were performed as explained in Figure 2B. Subcellular localization of DR5-AS was determined by qPCR analyses of nuclear and cytoplasmic RNAs isolated from cisplatin-treated HeLa cells. MALAT1 and GAPDH were used as markers for nuclear and cytoplasmic fractions, respectively. Ct values for the cytoplasmic and nuclear GAPDH were 9.7 and 13.9, respectively. Ct values for DR5-AS for the cytoplasmic and nuclear fractions were 25.2 and 20.8, respectively. p > 0.05, p ≤ 0.05, ∗∗p ≤ 0.01, ∗∗∗p ≤ 0.001, and ****p ≤ 0.0001.

DR5-AS knockdown modulates cell morphology in HeLa cells. (A) qPCR analyses of DR5-AS expression. HeLa cells were transfected with various GapmeRs or overexpression vectors for 72 and 48 h respectively and the amount of DR5-AS transcript was measured with qPCR. (B) qPCR analyses of DR5 sense mRNA expression. HeLa cells were transfected as explained in Figure 4A and DR5 expression was measured by qPCR. (C) Quantitative number of metaphase block cells in DR5-AS knockdown (DR5-AS-GapmeR-1), overexpression (pcDNA3.1-DR5-AS), and co-transfection groups. The same number of cells were visually counted under the microscope from at least three different regions and the percentage of amorphic cells was plotted. (D) Brightfield images of transfected cells after incubation period. (D’) The magnified areas of the parts encircled in white. Scale bar 50 μm. Negative GapmeR was used as negative control for transfection. pcDNA3.1 represents the empty vector for overexpression. ns, non-significant, p > 0.05, ∗∗p ≤ 0.01, ∗∗∗p ≤ 0.001, and ****p ≤ 0.0001.

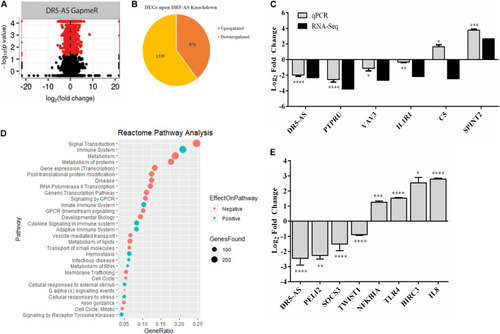
Figure 5. DR5-AS-knockdown-mediated perturbations in gene expression. Total RNAs isolated from HeLa cells transfected with negative GapmeR or DR5-AS GapmeR were subjected to RNA-seq. A volcano plot and pie chart of differentially expressed genes after knockdown are presented in (A,B), respectively. (C) qPCR validation of some genes differentially expressed in DR5-AS knockdown HeLa cells. (D) Reactome Pathway analysis of genes differentially expressed in HeLa cells transfected with DR5-AS GapmeR. (E) qPCR analyses of immune system-related genes as determined to be differentially expressed based on the Reactome pathway analysis. p ≤ 0.05, ∗∗p ≤ 0.01, ∗∗∗p ≤ 0.001, and ****p ≤ 0.0001.

DR5-AS knockdown modulates proliferation and cell cycle in HeLa cells. (A) The rate of early apoptosis in HeLa cells under various transfection conditions was determined by flow cytometry. HeLa cells were transfected with DR5-AS GapmeR alone (DR5-AS GapmeR-1 and DR5-AS GapmeR-2) or in combination of DR5-AS GapmeR-1 with pcDNA3.1-DR5-AS (co-transfection). Only cell (no transfection), transfection reagent (no GapmeR or plasmid) and negative GapmeR were used as controls. 72 h post-transfection, the rate of early apoptotic cells was determined by Annexin V/7AAD staining. The stained cells were analyzed by a flow cytometer. (B) Proliferation rate of HeLa cells transfected with DR5-AS GapmeR alone (DR5-AS GapmeR-1 and DR5-AS GapmeR-2) or in combination of DR5-AS GapmeR-1 with pcDNA3.1-DR5-AS (cotransfection) for 72 h. Untransfected (Negative control) and transfected (Transfection Reagent, Negative GapmeR, DR5-AS-GapmeR-1 or co-transfection) HeLa cells described in Figure 4C were also subjected to cell cycle analysis and the percent of cells in each phase (C) was calculated from DNA histograms (D). (E) qPCR analyses of genes associated with cell cycle in DR5-AS knockdown HeLa cells (Negative GapmeR versus DR5-AS-GapmeR-1). ns, non-significant (p > 0.05), *p ≤ 0.05, **p ≤ 0.01, ***p ≤ 0.001, ****p ≤ 0.0001.

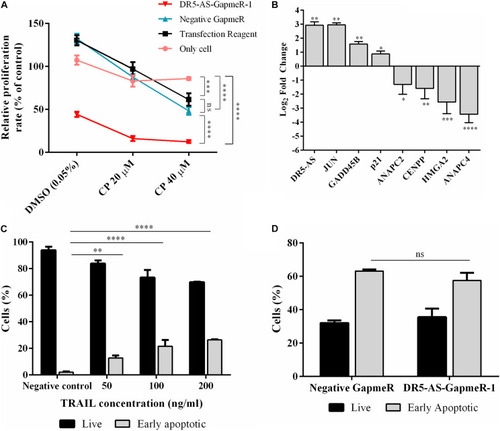
Cisplatin- and TRAIL-induced cellular changes in DR5-AS knockdown HeLa cells. (A) Proliferation rate of cisplatin-treated HeLa cells transfected with DR5-AS GapmeR. HeLa cells were transfected with DR5-AS GapmeR-1 for 72 h and then treated with cisplatin for additional 16 h. Proliferation rate of cells was measured by WST-1 assay. “Only cell” (no transfection), “transfection reagent” (cells transfected with transfection reagent only), and negative GapmeR were used as controls. (B) qPCR analyses of cell cycle-associated genes in cisplatin-treated HeLa cells. HeLa cells were treated with 80 μM cisplatin for 16 h and qPCR analyses were carried out with total RNAs isolated from control (0.1% DMSO) and cisplatin-treated cells. (C) Dose response of HeLa cells treated with TRAIL for 3 h treatment. (D) Apoptosis rate of HeLa cells after TRAIL treatment. HeLa cells were treated with 200 ng/ml TRAIL for 3 h. The rate of apoptosis was measured by flow cytometry following Annexin V/7AAD staining. ns, non-significant, p > 0.05, p ≤ 0.05, ∗∗p ≤ 0.01, ∗∗∗p ≤ 0.001, and ****p ≤ 0.0001.

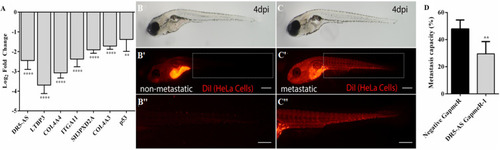
Analysis of metastasis rate in zebrafish xenograft assay. (A) qPCR analysis of metastasis-related genes in HeLa cells transfected with DR5-AS GapmeR-1. DR5-AS was knocked down in HeLa cells by transfecting the cells with DR5-AS GapmeR-1 for 72 h. qPCR was carried out with total RNAs isolated from cells transfected with negative GapmeR and DR5-AS GapmeR-1. To examine the metastasis rate in the zebrafish xenograft assay (B–C”), control cells and DR5-AS GapmeR treated cells were injected to the yolk of 2 dpf zebrafish. (B–B”) Xenografts with non-metastatic tumors display local tumors at the injection site (B’). No tumor cells are detectable in the body (B”). In metastatic xenografts (C–C”), tumor cells are detected in the injection site (C’) and rest of the body (C” a closeup view of cells in the tail region). (D) Percentage of metastatic larvae is 47.9% in control group whereas it is 29.5% in DR5-AS GapmeR group. The graph is plotted based on average of 3 replicates of each cell type (n = 18–20 per set), and 2 independent experiments. Dashed boxes in (B’,C’) indicate the regions imaged in (B”,C”), respectively. Scale bars represent 500 μm. Images were recorded with Olympus SZX16 stereomicroscope. **p ≤ 0.01, ****p ≤ 0.0001.

Acknowledgments
This image is the copyrighted work of the attributed author or publisher, and ZFIN has permission only to display this image to its users. Additional permissions should be obtained from the applicable author or publisher of the image. Full text @ Front Cell Dev Biol