
FIGURE SUMMARY
- Title
-
Meningeal lymphatic endothelial cells fulfill scavenger endothelial cell function and cooperate with microglia in waste removal from the brain
- Authors
- Huisman, Y., Uphoff, K., Berger, M., Dobrindt, U., Schelhaas, M., Zobel, T., Bussmann, J., van Impel, A., Schulte-Merker, S.
- Source
- Full text @ Glia
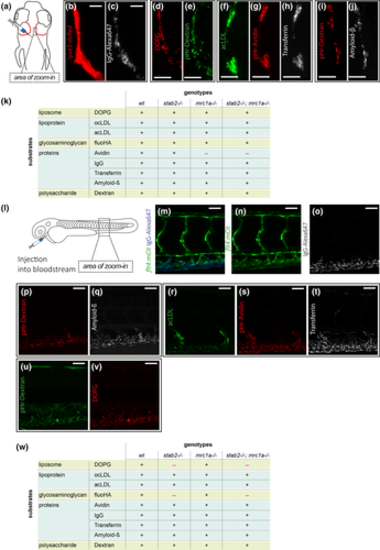
BLECs in the meningeal layer and scavenger endothelial cells (SECs) in the cardinal vein show the same substrate specificity. (a) Cartoon depicting the zebrafish head region (dorsal view, anterior at the top) with the position of the two BLEC loop structures highlighted in red. The boxed area shows the position of the maximum projection of BLECs depicted in (b-j). Injection of the different fluorescently labeled substrates occurred either into the center of the optic tectum or into the ventricles of embryos at 5dpf. (b,c) Uptake of IgG-Alexa647 by BLECs. Dorsal confocal projections of a lyve1:DsRed positive BLEC (b), which has internalized fluorescent IgG-Alexa647 (c). (d-j) Confocal projections of BLECs that have internalized the indicated substrate combinations. (k) Overview about the uptake of the analyzed classes of substrate molecules by BLECs in either wild type, stab2 −/− mutant, mrc1a −/− mutant or stab2−/−;mrc1a−/− double mutant embryos. (l) Schematic overview of a zebrafish embryo, depicting injection of different fluorescent dyes into the bloodstream. Examples of substance uptake by SECs in the cardinal vein (boxed area) is shown in (m-v). (m-o) Maximum projection highlighting venous and lymphatic endothelial cells by flt4:mCitrine expression (n) and showing accumulation of the injected IgG-Alexa647 in the cardinal vein area (o). Uptake of different substrates by SECs in the cardinal vein (p-v). (w) Summary of the SEC uptake capacity for different classes of substrates which were tested in wild type, stab2 −/− mutant, mrc1a −/− mutant and stab2−/−;mrc1a −/− double mutants. (m-o) mrc1a +/−, (p–t) wild type embryo; (u-v) mrc1a +/−. Scale bars in (b-j) represent 12.5 μm and in (m-v) 50 μm
|
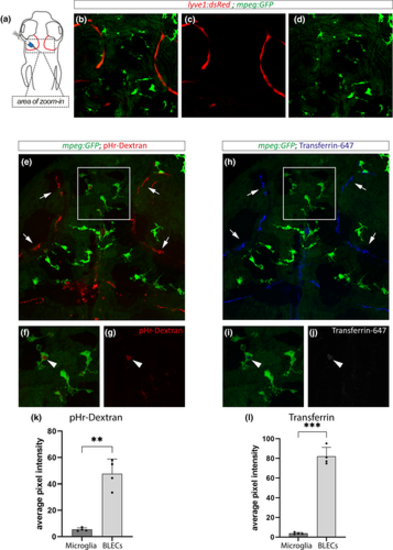
Microglia are significantly less efficient in the uptake of dextran and Transferrin from the brain parenchyma compared to BLECs. (a) Schematic overview of the dorsal head region of a zebrafish embryo indicating the zoom-in area in (b-d, e, h). (b-d) Maximum projection showing the characteristic loops of lyve1:DsRed positive BLECs on top of the optical tecta and indicating the position of mpeg:GFP positive microglia at 5dpf. (e-j) mpeg:GFP positive zebrafish embryo in which pHr-dextran (e) and Transferrin-647 (h) were co-injected into the brain parenchyma. Arrows highlight an uptake of the respective substance by BLECs. (f, g) and (i, j) zoom-in of the boxed region in (e) and (h), respectively. Arrowheads indicate cargo uptake in a macrophage. (k) Quantification of the average pixel intensity of pHr-dextran shows a significantly higher uptake in BLECs compared to microglia (Welch's t-test, p = .0044). (l) The average pixel intensity for Transferrin-647 in BLECs is significantly higher compared to microglia (Welch's t-test, p = .0004). Number of analyzed embryos was n = 4. Values are presented as means ± SD
|
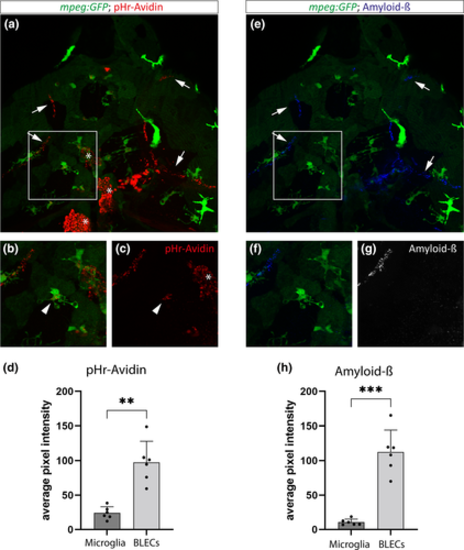
Microglia take up Avidin and Amyloid-β less efficiently than BLECs. (a-c) Maximum projections of a 5dpf mpeg:GFP positive embryo in which pHr-Avidin was injected into the optic tectum. Note the auto-fluorescence in the red channel, marked by asterisks. (d) The average pixel intensity of the pHr-Avidin signal is significantly lower in microglia compared to BLECs (Welch's t-test, p = .0014). (e-g) Maximum projections of the same embryo, showing the distribution of HiLyte Fluor 647-labeled Amyloid-β (1–40) protein after parenchymal administration. (b, c and f, g) Zoom-in of the indicated regions in (a) and (e), respectively. Arrows highlight an uptake event in BLECs, arrowheads indicate an uptake by a mpeg + macrophage. (h) Quantification of the average pixel intensity of Amyloid-β accumulating in microglia and BLECs results in significantly higher values for BLECs as compared to microglia (Welch's t-test, p = .0005). Number of embryos analyzed was n = 4. Values are presented as means ± SD
|
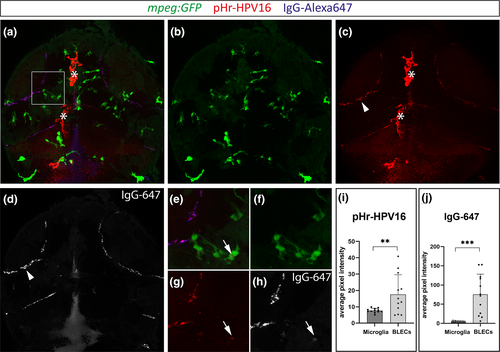
BLECs ingest HPV-16 pseudoviruses more efficiently than microglia. (a-d) Maximum projection of a mpeg:GFP positive zebrafish embryo that was co-injected with pHr-HPV-16 and IgG-Alexa647 into the CSF at 5dpf. The white box indicates the zoom-in area in (e-h). Single channel of maximum projection in (a) for mpeg:GFP (b), pHr-HPV-16 (c) and IgG-Alexa647 (d). Arrowheads highlight uptake into BLECs while arrows mark endocytosis of the respective substrate in microglia. Note the auto-fluorescence of pigment cells in the red channel, marked by asterisks. (i, j) Quantification of the average pixel intensities within mpeg:GFP+ microglia and BLECs in n = 12 embryos shows a significantly higher uptake of pHr-HPV-16 (Welch's t-test, p = .0097) and IgG-Alexa647 (Welch's t-test, p = .0001) in BLECs when compared to microglia. Values are presented as means ± SD
|
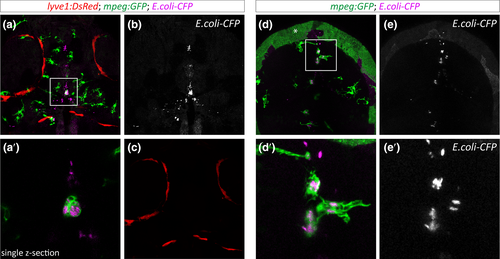
Microglia but not BLECs internalize CFP-labeled Escherichia coli from the brain parenchyma. (a-c) Maximum projection of the head region (dorsal view) of a lyve1:DsRed; mpeg:GFP double transgenic embryo that was injected with CFP-labeled E. coli at 5dpf. (a') Single confocal slice of the boxed area in a, showing uptake of E. coli by a GFP-positive macrophage. (d-e') Partial projection of a mpeg:GFP positive embryo that was injected with CFP-labeled E. coli. The box indicates the area of zoom-in in (d′) and (e'). Note that the green signal marked by an asterisk in (d) represents auto-fluorescence of the embryo
|
Acknowledgments
This image is the copyrighted work of the attributed author or publisher, and
ZFIN has permission only to display this image to its users.
Additional permissions should be obtained from the applicable author or publisher of the image.
Full text @ Glia