FIGURE SUMMARY
Title

A backward-mode optical-resolution photoacoustic microscope for 3D imaging using a planar Fabry-Pérot sensor

Authors
Baumann, E., Pohle, U., Zhang, E., Allen, T., Villringer, C., Pulwer, S., Gerhardt, H., Laufer, J.
Source
Full text @ Photoacoustics

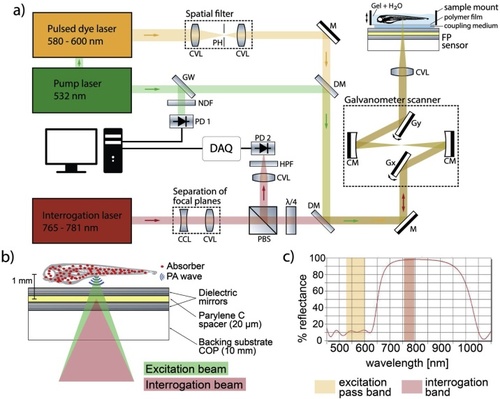
Experimental setup of the backward-mode OR-PAM system based on a planar Fabry-Pérot (FP) ultrasound sensor. a Schematic of the OR-PAM system. b Schematic of the FP sensor. c Reflectance spectrum of the dielectric mirrors of the FP sensor.

CCL = Concave Lens, CM = Concave Mirror, CVL = Convex Lens, DAQ = Data Acquisition, DM = Dichroic Mirror, FP = Fabry-Pérot, GW = Glass Window, Gx = X-Galvanometer mirror, Gy = Y-Galvanometer mirror, HPF = High-Pass Filter, M = Mirror, NDF = Neutral Density Filter, PBS = Polarizing Beamsplitter, PD = Photodiode, PH = Pinhole, λ/4 = Quarter-Wave Plate

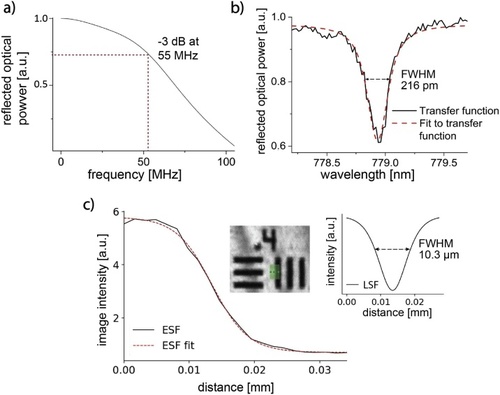
Scanner characterization. a Frequency response of an FP sensor with a dielectric mirror reflectivity of 98 % and spacer thickness 20 μm (using the model published in [28]). b Typical interferometer transfer function (ITF). c Edge-spread function (ESF) corresponding to the averaged image intensity along the green line in the continuous-scanning OR-PAM image of a resolution target shown in the left inset. The FWHM of the line-spread function (LSF, right inset) was obtained as a measure of the lateral resolution. On average, it was found to be (8.1 ± 1.4) μm in the raster-scanning and (11.8 ± 1.7) μm in the continuous-scanning mode.

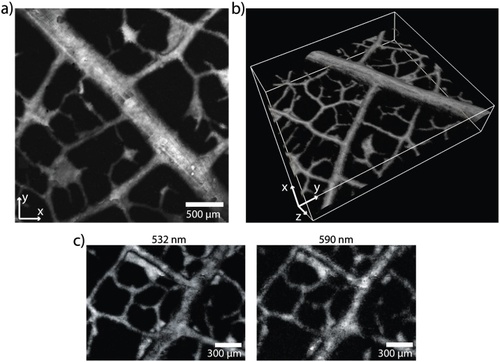
OR-PAM image of a leaf skeleton phantom acquired in raster-scanning mode. a x-y-maximum intensity projections (MIP) of the image. b Volume-rendered 3D image of an OR-PAM data set. c Comparison of OR-PAM images of the same leaf skeleton phantom obtained at excitation wavelengths of 532 nm and 590 nm, respectively.

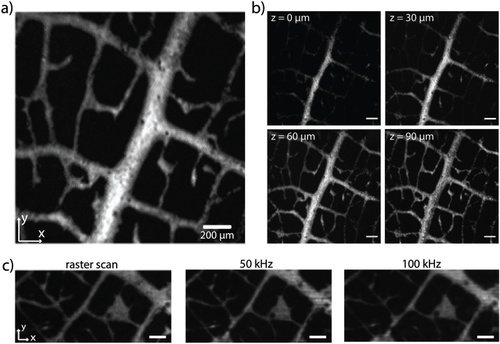
OR-PAM image of a leaf skeleton phantom acquired in continuous-scanning mode. The scale bar represents 200 μm. a xy-MIP of the Hilbert transform of the PA signals. b z-slices at different depths of the data set shown in (a). c Comparison of images acquired in raster-scanning mode, at a PRR of 50 kHz, and at 100 kHz in continuous-scanning mode.

In vivo OR-PAM of a zebrafish embryo (4 dpf) acquired in raster-scanning mode. ax-y-, x-z-, and y-z-MIPs of the image. b Volume-rendered 3D image of the same data set shown in (a). c Zebrafish anatomy in a bright-field microscopy image for reference. Scale bars represent 300 μm.

Acknowledgments
This image is the copyrighted work of the attributed author or publisher, and ZFIN has permission only to display this image to its users. Additional permissions should be obtained from the applicable author or publisher of the image. Full text @ Photoacoustics