
- Title
-
An inhibitor-mediated beta cell dedifferentiation model reveals distinct roles for FoxO1 in glucagon repression and insulin maturation
- Authors
- Casteels, T., Zhang, Y., Frogne, T., Sturtzel, C., Lardeau, C.H., Sen, I., Liu, X., Hong, S., Pauler, F.M., Penz, T., Brandstetter, M., Barbieux, C., Berishvili, E., Heuser, T., Bock, C., Riedel, C.G., Meyer, D., Distel, M., Hecksher-Sørensen, J., Li, J., Kubicek, S.
- Source
- Full text @ Mol Metab

Cellular model for FoxO-mediated beta-cell dedifferentiation. A. Schematic overview of our cellular model for FoxO-mediated beta-cell dedifferentiation, with potential to screen for inhibitors. B. Transcription of Ins2, Gcg, and Ngn3 in Min6 cells after two-day FoxO inhibitor (FoxOi, 1 μM unless otherwise stated) treatment, as measured by qPCR. C. Western blot of glucagon and insulin protein expression in Min6 cells following two-day FoxO inhibitor treatment. D. Measurement of insulin and glucagon intensity in Min6 cells treated with FoxO inhibitor at the single cell level, as quantified by immunofluorescence. E. Representative images of Min6 cells stained for insulin and glucagon after two-day treatment. Scale bars = 10 μm. F. RNAseq transcriptional expression changes in pancreatic endocrine factors after two-day FoxOi treatment versus control DMSO treatment in Min6 cells. All RNAseq results are representative of three biological replicates (n = 3). G. Gene set enrichment analysis (GSEA) showing downregulation of mouse (left) [58,59] and human (right) [61] beta-cell-specific genes with FoxO inhibitor treatment. |
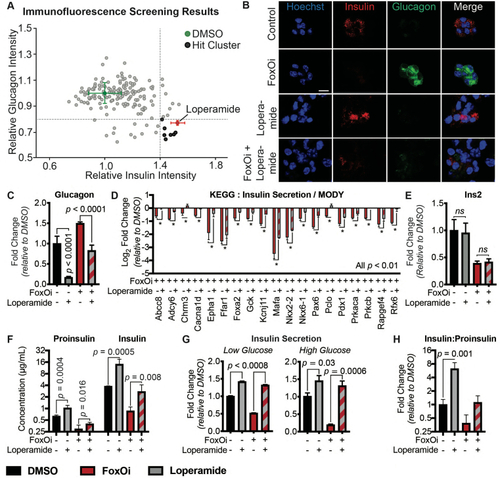
High-content screen identifies loperamide to counter aspects of FoxOi-mediated beta-cell dedifferentiation.A. Overview of the small-molecule screening results. All the results were normalized to the DMSO control. Each dot represents the mean value of three replicates. Results whose standard deviations were more than 20% of the mean values were removed. Compounds that decreased mean cell numbers by more than 20% were considered cytotoxic and were also removed. Hit cluster = all compounds that yielded a greater than 1.5-fold increase in insulin intensity. B. Representative images of Min6 cells treated with/without FoxO inhibitor in combination with loperamide (5 μM unless otherwise stated). Scale bar = 10 μm. C. Loperamide suppresses FoxOi-induced glucagon transcription in Min6 cells, as measured by RNAseq with fragments per kilobase of transcript per million mapped reads (FPKM). D. Rescue of the expression of genes involved in insulin secretion with loperamide in Min6 cells treated with FoxOi for 48h, as measured by RNAseq. E. Loperamide does not affect insulin mRNA levels, as measured by RNAseq. F. Intracellular insulin and proinsulin protein concentrations in Min6 cells following 48h FoxOi/loperamide treatment, as measured by ELISA. G. Insulin secretion from Min6 cells in low (0.3 g/L) and high (3 g/L) glucose medium pretreated with FoxOi and loperamide for 48h. H. Insulin to proinsulin total protein ratio following 48h FoxOi/loperamide treatment, relative to DMSO control, measured by ELISA. |
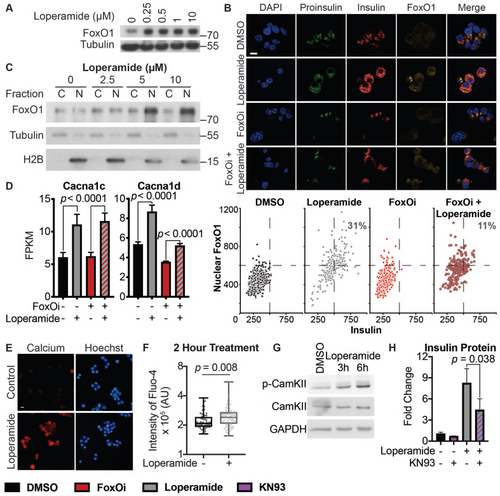
Loperamide increases FoxO1 expression and nuclear localization promoting changes in calcium signaling.A. Western blot showing an increase of FoxO1 protein with loperamide treatment in Min6 cells. B. Top: Representative immunofluorescence images of Min6 cells treated with loperamide and FoxOi for 48h. Scale bar = 10 μm. Bottom: Quantification of insulin and nuclear FoxO1 intensities at the single cell level. C. Western blot of FoxO1 protein expression in the cytoplasm vs. nucleus of Min6 cells following different doses of loperamide treatment. D. mRNA levels of L-type voltage-gated calcium channels Cacna1c and Cacna1d in Min6 cells upon 48h loperamide and FoxOi treatment, as measured by RNAseq. E. Fura-2 staining in Min6 cells pretreated with loperamide for 18h. F. Quantification of Fluo-4 staining at the single cell level in Min6 cells treated with loperamide for 2h. G. Western blot highlighting an increase in p-CamKII relative to total CamKII protein levels in Min6 cells when treated with loperamide for the stated hours. H. Total mature insulin protein levels in Min6 cells treated with loperamide and 1 μM KN-93 for 24h. |
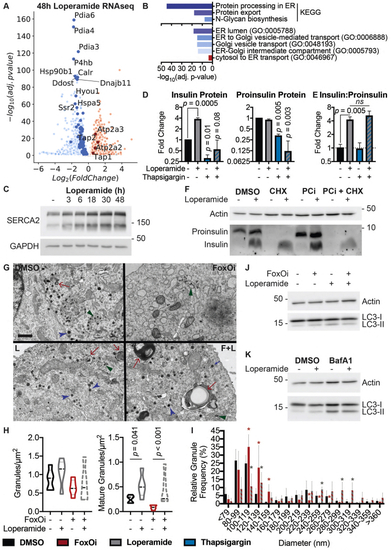
Loperamide alters ER proteome, rescuing FoxOi-induced arrest in insulin granule maturation and promotes autophagy.A. Volcano plot of gene expression changes upon 48h loperamide treatment, as measured by RNAseq. B. Overview of top enrichment terms for genes both significantly altered by loperamide relative to control and significantly rescued when co-treated with FoxOi relative to FoxOi. Volcano plot highlights the top KEGG term (protein processing in ER) in blue and GO:0046967 in red. C. Western blot showing increase in SERCA2 protein upon loperamide treatment in Min6 cells. D. Total intracellular insulin and proinsulin protein levels in Min6 cells treated with loperamide and 100 nM thapsigargin for 24h, as quantified by ELISA. E. Ratio of mature insulin to proinsulin protein. F. Western blot of proinsulin and insulin protein levels following 48h treatment of Min6 cells with loperamide +/− 200 μg/mL cycloheximide (CHX) or 10 μM prohormone convertase inhibitor (PCi) for the final 24h. G. Representative electron microscopy images of Min6 cells treated with FoxOi or loperamide. L = Loperamide; F + L = FoxOi + Loperamide. Green arrows pointing to immature secretory granules. Red arrows highlighting (autophago-)lysosomes. Blue arrows indicate mature insulin secretory granules. Scale bar = 1 μm. H. Quantification of insulin granule density in electron microscopy images. Total number of granules per μm2 (right) and number of mature (>160 μm in diameter) granules per μm2. N = 5 cells per treatment condition. I. Histogram of insulin granule size distribution upon FoxOi/loperamide treatment. DMSO = black; FoxOi = red; FoxOi + Loperamide = red/gray stripes. N = 5 cells per treatment condition. J. Levels of LC3B in Min6 cells treated with FoxOi and loperamide for 48h. K. Levels of LC3B in Min6 cells treated with loperamide for 48h +/− 200 nM bafilomycin A1 for the final 2h. |

Loperamide counters FoxO inhibition in different model systems.A. Overview of C. elegans development in favorable or unfavorable environmental conditions. B. Effects of FoxOi and loperamide treatment on the FOXO-dependent developmental process of Dauer formation in C. elegans. Eggs of CB1370 animals were hedged and grown at 23 °C (left panel) or 22 °C (right panel) in the presence of FoxOi or loperamide at the indicated concentrations. In the absence of compounds (0 μM), the fraction of animals forming Dauer was 20.2% (left panel) and 3.2% (right panel). Compound-induced fold changes of this fraction are shown. N = 3; 100 animals per condition and replicate. C. Representative images of developmental defects in zebrafish larvae following 48h FoxOi treatment and rescue with loperamide. D. Quantification of insulin or glucagon-positive cells following loperamide treatment in zebrafish larvae. Ncontrol = 12; Nloperamide = 21. E. Representative images of pancreatic human islets stained for insulin and glucagon. Scale bars = 10 μm. On the right: Summary of the population distribution change in the human islets. F. Measurement of INS and GCG transcription in human islets treated with loperamide by RT-qPCR. All the data points are normalized to DMSO control, n = 4. G. Transcription of GCG, INS, and PDX1 in pancreatic islets from human diabetic donors treated for 48h with loperamide, as measured by RT-qPCR, n = 2. H. Glucose-stimulated insulin secretion assay on diabetic human islets pretreated with loperamide for 48 h, n = 2. Basal = 0.3 g/L glucose; stimulated = 3 g/L glucose. I. Relative insulin and Pdx1 mRNA levels in islets from db/db mice pretreated with loperamide for 48h. |

Loperamide has positive systemic and islet-specific in vivo effects in diabetic mice.A. Serum glucose concentrations after overnight fast (0 min) and 20 min after IP injection with 1 g/kg glucose (20 min). N = 5 mice/treatment. B. Body weight measured after 4-week treatment. C. Serum insulin concentration measured by ELISA. D. Serum glucagon concentration measured by ELISA. E. Representative immunofluorescence panel of pancreas sections stained with insulin and glucagon antibodies. White arrows point to insulin/glucagon double-positive cells. Scale bar = 100 μm. F-J. Quantifications of immunofluorescence images. N = 45 islets/treatment from five different mice/treatment. F. Percent of total islet pixel number representing colocalized red/green channel pixels. G-H. Thresholded Manders’ correlation coefficients for the insulin (red) channel or glucagon (green) channel per islet. I-J. Percent of total islet volume occupied by the insulin (red) channel or glucagon (green) channel pixels. K. Representative immunofluorescence panel of db/db mouse pancreas sections 4-week post-loperamide treatment, stained for insulin and Aldh1a3. Scale bar = 20 μm. L. Quantification of immunofluorescence images. Cytoplasmic Aldh1a3 intensity was only calculated within insulin-positive cells. POC = percent of control. N = 38 islets/treatment from five different mice/treatment. |
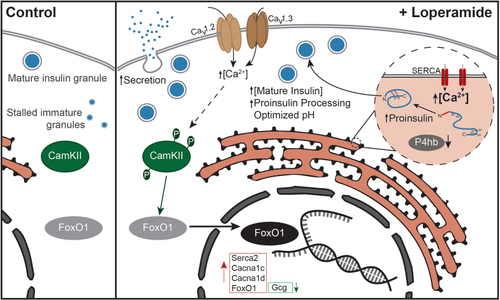
Overview of loperamide's effects in beta cells. |