
- Title
-
Lipopolysaccharides Enhance Epithelial Hyperplasia and Tubular Adenoma in Intestine-Specific Expression of krasV12 in Transgenic Zebrafish
- Authors
- Lu, J.W., Sun, Y., Fong, P.A., Lin, L.I., Liu, D., Gong, Z.
- Source
- Full text @ Biomedicines
|
DSS or LPS enhances the increase in intestinal neutrophils and macrophages in kras+/lyz+ and kras+/mepg1+ zebrafish larvae. (A,C,E,G) Fluorescence of neutrophils and macrophages in the intestine. (B,D,F,H) Quantification of the number of positive cells as revealed by fluorescence of neutrophils or macrophages. Differences among the variables were assessed using Student’s t-tests. Statistical significance: * p < 0.05, ** p < 0.01, *** p < 0.001. Scale bar: 25 μm. 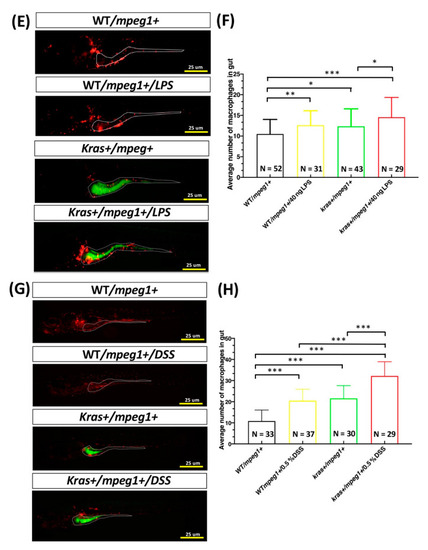

|
|
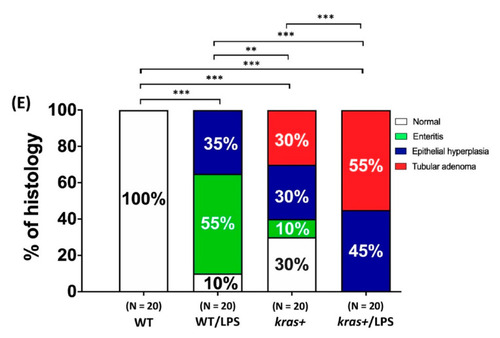
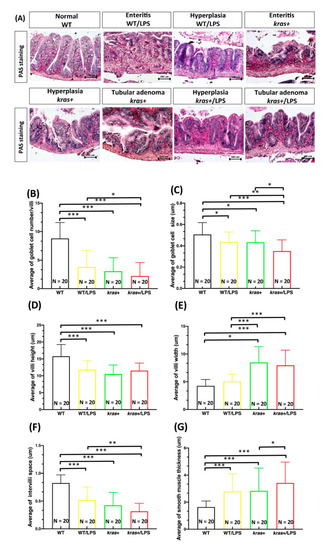
Synergistic effect of krasV12 expression and LPS treatment in intestinal tumorigenesis. Four-month-postfertilization WT and kras+ zebrafish were cotreated with 2 μM of mifepristone and 40 ng/mL of LPS for 4 weeks, and samples were then collected for gross observations and histological analyses. There were four experimental groups: WT, WT/LPS, kras+, and kras+/LPS. (A,B) Body length and body weight. (C) Survival curves. (D) Examples of normal intestines, enteritis, hyperplasia, and tubular adenoma as revealed by H&E-stained sections of the intestine. (E) Summary of intestinal histological abnormalities observed in the four experimental groups. These data were generated from results of a blinded histological analysis (WT, N = 20; WT/LPS, N = 20; kras+, N = 20; kras+/LPS, N = 20). Differences among the variables were assessed using Student’s t-tests or one-way ANOVA. Statistical significance: * p < 0.05, ** p < 0.01, *** p < 0.001. Scale bar: 50 μm. 
PHENOTYPE:
|
Expression of PHENOTYPE:
|
|
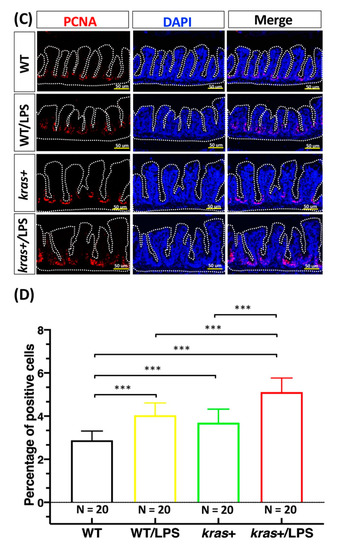
Expression of krasV12 with LPS treatment enhanced the increase in cell apoptosis and cell proliferation in the intestinal epithelium. (A,C) Immunofluorescence staining (red) was carried out in intestinal paraffin sections of WT (N = 20), WT/LPS (N = 20), kras+ (N = 20), and kras+/LPS (N = 20) zebrafish. (B,D) Immunofluorescence staining of caspase-3 showing (1) apoptosis and (2) PCNA as a marker for cell proliferation as well as (3) quantification of the number and percentage of positive cells. Differences among the variables were assessed using Student’s t-tests. Statistical significance: * p < 0.05, *** p < 0.001. Scale bar: 50 μm. 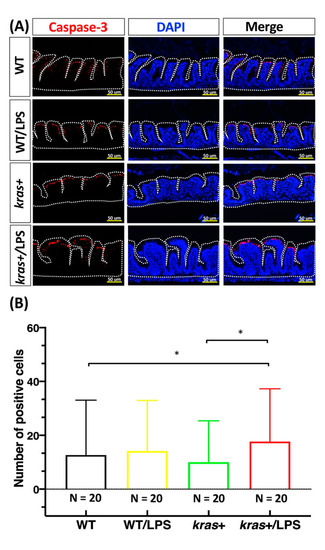
PHENOTYPE:
|
|
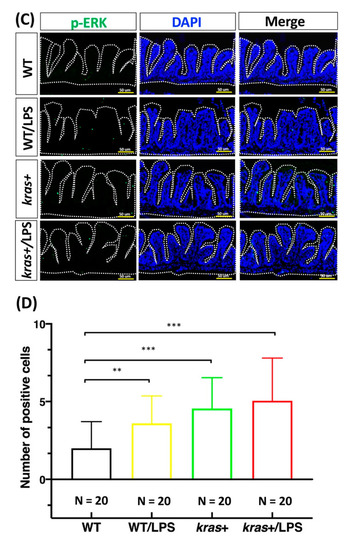
Expression of krasV12 with LPS treatment enhanced the increase in p-AKT in intestinal epithelial cells. (A,C) Immunofluorescence staining (red) was performed on intestinal paraffin sections of WT (N = 20), WT/LPS (N = 20), kras+ (N = 20), and kras+/LPS (N = 20) zebrafish. (B,D) Immunofluorescence staining of p-AKT and p-ERK as a marker of RAS signaling and quantification of the number of positive cells. Differences among the variables were assessed using Student’s t-tests. Statistical significance: * p < 0.05, ** p < 0.01, *** p < 0.001. Scale bar: 50 μm. 
PHENOTYPE:
|
|
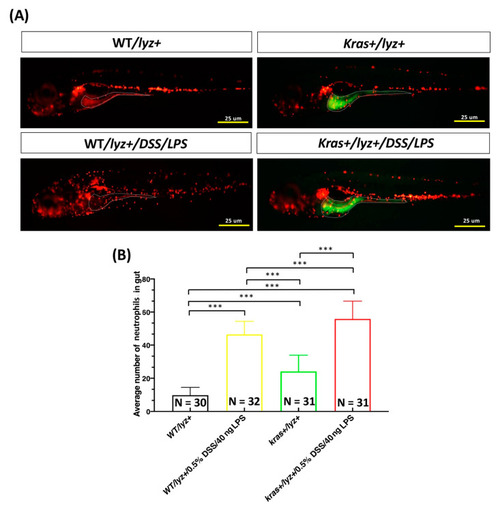
Cotreatment with DSS and LPS exacerbated the increased number of neutrophils and macrophages in the intestines of kras+/lyz+ and kras+/mepg1+ zebrafish. (A,C) Fluorescence of neutrophils (WT/lyz+, N = 30; WT/lyz+/DSS/LPS, n = 32; kras+/lyz+, n = 31; kras+/lyz+/DSS/LPS, n = 31) or macrophages (WT/mpeg1+, N = 30; WT/mepg1+/DSS/LPS, N = 30; kras+/mpeg1+, N = 30; kras+/mepg1+/DSS/LPS, N = 30) in the intestines. (B,D) Quantification of the number of positive cells as revealed by fluorescence of neutrophils or macrophages. Differences among the variables were assessed using Student’s t-tests. Statistical significance: *** p < 0.001. Scale bar: 25 μm. 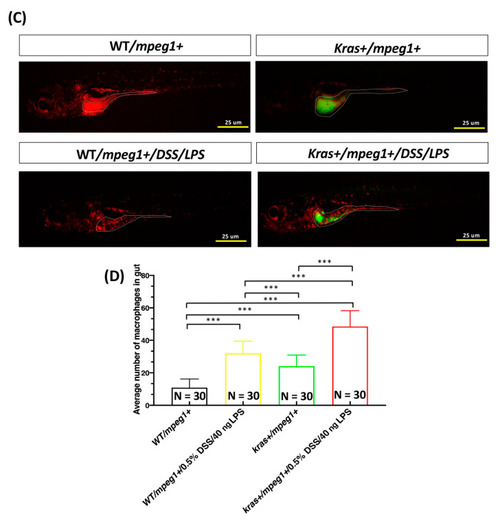
|
|
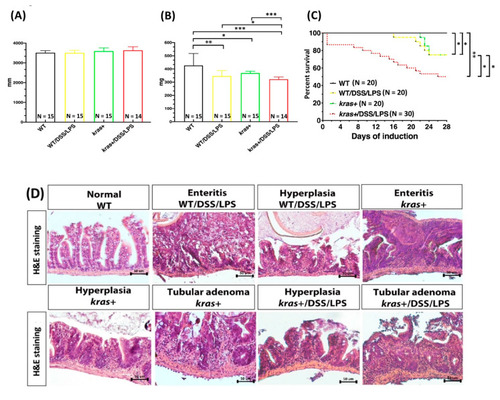
Synergistic effect of krasV12 expression and LPS/DSS on intestinal tumorigenesis. Four-month-postfertilization wild-type and kras+ zebrafish were cotreated with 2 μM of mifepristone, 40 ng/mL of LPS, and 0.0625% DSS for 4 weeks, and samples were then collected for gross observations and histological analyses. There were four experimental groups: WT, WT/DSS/LPS, kras+, and kras+/DSS/LPS. (A,B) Body length and body weight. (C) Survival curves. (D) Examples of normal intestines, enteritis, hyperplasia, and tubular adenoma as revealed by H&E staining of intestinal sections. (E) Summary of intestinal histological abnormalities observed in the four experimental groups. These data were generated as a result of a blinded histological analysis (WT, N = 10; WT/DSS/LPS, N = 10; kras+, N = 11; kras+ with DSS/LPS, N = 11). Differences among the variables were assessed using Student’s t-tests or one-way ANOVA. Statistical significance: * p < 0.05, ** p < 0.01, *** p < 0.001. Scale bar: 50 μm. 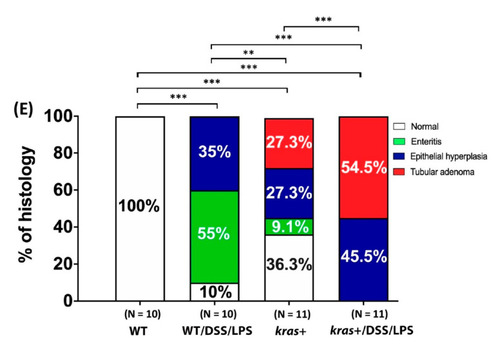
PHENOTYPE:
|