
- Title
-
A zebrafish model for calcineurin-dependent brain function
- Authors
- Edmister, S.T., Ibrahim, R., Kakodkar, R., Kreiling, J.A., Creton, R.
- Source
- Full text @ Behav. Brain Res.

Fig. 1. Model of calcineurin signaling. Intracellular free calcium activates calcineurin, which dephosphorylates various target proteins, including the nuclear factor of activated T-cells (NFAT), BCL2-associated death protein (BAD) and glycogen synthase kinase-3 (GSK-3). Calcineurin can be inhibited by the ‘Regulator of Calcineurin’, RCAN1 (previously called the ‘Down syndrome critical region’, DSCR1), or by small molecules such as cyclosporine (CsA) and tacrolimus (FK506). DYRK1A inhibits the calcineurin-NFAT pathway by phosphorylating NFAT. The small molecule INDY inhibits the inhibitor DYRK, which leads to increased NFAT signaling. ProINDY can be used as a cell-permeable prodrug to deliver INDY inside a cell. Note: NFAT, DYRK and RCAN in mammals are named nfat, dyrk, rcan (genes) or Nfat, Dyrk, Rcan (proteins) in zebrafish. |

Fig. 2. Imaging of zebrafish larval behavior. Five-day-old larvae were imaged for 3 h in a 384-well format (four 96-well plates). Left: overview of four plates. Right: individual well with a zebrafish larva located ‘down’ in the lower half of the well (plate 4, well D5). Moving lines (red, green or blue) were projected through the bottom of the 96-well plates for measurements of the optomotor response (OMR). Larval activity and location were measured by automated image analysis to prevent observer bias and fatigue. Inner well diameter = 7.15 mm. |
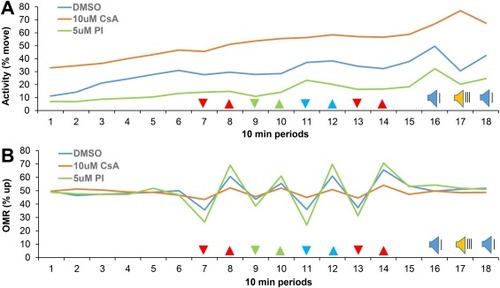
Fig. 3. Measurements of zebrafish larval behavior. A) Activity in subsequent 10 min periods (18 periods, 3 h total). Cyclosporine (CsA) induced an increase in activity and proINDY (PI) induced a decrease in activity. B) The optomotor response (OMR); zebrafish larvae swim in the same direction as moving lines projected through the bottom of a 96-well plate. Cyclosporine induced a decrease in the optomotor response and proINDY induced an increase in the optomotor response. % move = the percentage of time that larvae move. % up = the percentage of time that a larvae are located in the upper half of a well. The arrowheads indicate the color and direction of the visual stimuli. For example, red lines move down in period 7 and move up in period 8. The red lines in period 13 and 14 move 16x faster than the red, green and blue lines in period 7-12. Blue speaker = acoustic stimuli with a 20-second interval. Yellow speaker = acoustic stimuli with a 1-second interval. Statistical analyses of activity and vision are shown in subsequent figures. N = 912, 372 and 383 larvae in the DMSO vehicle control, cyclosporine and proINDY group, respectively. PHENOTYPE:
|

Fig. 4. Larval activity. A) Early activity averaged during the first hour of imaging. B) Late activity averaged during period 15. Larvae were treated at 5 dpf with DMSO (2 μL/mL), cyclosporine (CsA, 10 μM), tacrolimus (FK506, 1 μM), rapamycin (RM, 1 μM), proINDY (5PI = 5 μM proINDY, 10PI = 10 μM proINDY), or a combination of two treatments. For example, in the CsA+5PI group, larvae were co-treated with 10 μM CsA and 5 μM PI. Differences between corresponding treatment groups were examined for significance using a Chi-square test with a Bonferroni correction for multiple comparisons. * p < 0.05/14, ** p < 0.01/14, *** p < 0.001/14. N = 912, 372, 188, 263, 383, 275, 190, 178, 93 and 86 larvae in the 10 subsequent treatment groups. The colors of the asterisks indicate differences as compared to the DMSO control (black asterisks), CsA group (red asterisks), FK506 group (yellow asterisks) and PI group (green asterisks). In an ideal rescue experiment, the co-treatments will have red, yellow or green asterisks (indicating differences between the co-treatment and single treatment), but will not have black asterisks (the co-treatment is similar to the DMSO control). PHENOTYPE:
|

Fig. 5. Optomotor response (OMR). A) Response to moving red lines. B) Response to moving green lines. C) Response to moving blue lines. D) Response to red lines, moving 16x faster than the moving lines in A-C. Larvae were treated at 5 dpf with DMSO (2 μl/mL), cyclosporine (CsA, 10 μM), tacrolimus (FK506, 1 μM), rapamycin (RM, 1 μM), proINDY (5PI = 5 μM proINDY, 10PI = 10 μM proINDY), or a combination of two treatments. Differences between corresponding groups were examined for significance using a Chi-square test with a Bonferroni correction for multiple comparisons. N = 912, 372, 188, 263, 383, 275, 190, 178, 93 and 86 larvae in the 10 subsequent treatment groups. * p < 0.05/14, ** p < 0.01/14, *** p < 0.001/14. PHENOTYPE:
|

Fig. 6. Responses to acoustic stimuli. A) Example of one imaging experiment analyzed during the final 40 min in 6-second intervals. B) Habituation to acoustic stimuli at 1-second intervals (first 5 min minus last 5 min of period 17). C) Startle responses (average activity in period 16 minus period 17). D) Excitability by acoustic stimuli at 1 s intervals (average activity in period 17 minus period 16). Larvae were treated at 5 dpf with DMSO (2 μl/mL), cyclosporine (CsA, 10 μM), tacrolimus (FK506, 1 μM), rapamycin (RM, 1 μM), proINDY (5PI = 5 μM proINDY, 10PI = 10 μM proINDY), or a combination of two treatments. Differences between corresponding groups were examined for significance using a Chi-square test with a Bonferroni correction for multiple comparisons. N in panel A = 96 larvae per treatment group. N in panel B, C and D = 912, 372, 188, 263, 383, 275, 190, 178, 93 and 86 larvae in the 10 subsequent treatment groups. * p < 0.05/14), ** p < 0.01/14), *** p < 0.001/14). |

Fig. 7. Recovery of behavior in 6 and 7 day-old larvae. After treatment and initial imaging at 5 days post fertilization (dpf), zebrafish larvae were grown in egg water and imaged again at 6 and 7 dpf. Changes in behavior were calculated (Treatment - DMSO) and color coded for a visual evaluation of altered behaviors. Note that most, but not all behaviors, recovered two days after the treatment at 7 dpf. Measurements of behavior included activity in the first hour (1 h) and period 15 (P15), optomotor responses to moving lines in red (R), green (G), blue (B), fast red (FR) and all colors and speeds combined (RGB), startle response (S), habituation (Hab) and excitability (E). |

Fig. 8. Hierarchical cluster analysis of behavioral profiles. Behaviors at 5 dpf were analyzed in Cluster 3.0, using the Euclidian distance metric with complete linkage. The clusters were then color coded in TreeView using a spectrum from green (25 % decrease) to red (25 % increase). Three main clusters were identified, each with a distinct behavioral profile: 1) the calcineurin inhibitors FK506 and CsA, 2) DMSO and rapamycin (RM), and 3) the DYRK1A inhibitor ProINDY (PI) at two concentrations. Measurements behavior include activity in the first hour (1 h) and period 15 (P15), optomotor responses to moving lines in red (R), green (G), blue (B), fast red (FR) and all colors and speeds combined (RGB), startle response (S), habituation (Hab) and excitability (E). |