
- Title
-
Insulin-producing β-cells regenerate ectopically from a mesodermal origin under the perturbation of hemato-endothelial specification
- Authors
- Liu, K.C., Villasenor, A., Bertuzzi, M., Schmitner, N., Radros, N., Rautio, L., Mattonet, K., Matsuoka, R.L., Reischauer, S., Stainier, D.Y., Andersson, O.
- Source
- Full text @ Elife
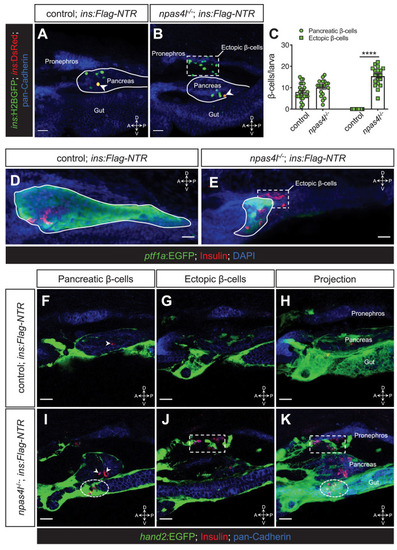
(A, B) Representative confocal projections of the pancreas and neighbouring tissues of control siblings and npas4l−/− Tg(ins:Flag-NTR);Tg(ins:H2BGFP;ins:DsRed) zebrafish larvae at 3 dpf after β-cell ablation by MTZ at 1–2 dpf, displaying regenerated β-cells in green and older β-cells that likely survived the ablation in yellow overlap as the DsRed fluorescence driven by the insulin promoter remained in these cells, at the same time as DsRed had not had enough time to mature in the regenerated β-cells (arrowheads). The ectopic β-cells are indicated by white dashed rectangle. Pancreata are outlined by solid white lines. (C) Quantification of the pancreatic or ectopic β-cells per larva at 3 dpf. ****p<0.0001 (Šidák’s multiple comparisons test); n = 24 (control) and 19 (npas4l−/−). Quantification data are represented as the mean ± SEM. (D, E) Representative image projections of the pancreas and neighbouring tissues in control siblings and npas4l-/- Tg(ins:Flag-NTR);Tg(ptf1a:EGFP) larvae at 3 dpf after β-cell ablation by MTZ at 1–2 dpf, displaying β-cells in red with immunostaining for insulin and ptf1a:EGFP+ exocrine pancreas in green. Pancreata are outlined by solid white lines. Dashed line outlines ectopic β-cells in the mesenchyme (E). (F–K) Representative images and projections of the pancreas and neighbouring mesenchyme of control siblings and npas4l-/- Tg(ins:Flag-NTR);Tg(hand2:EGFP) zebrafish larvae at 3 dpf after β-cell ablation by MTZ at 1–2 dpf, displaying β-cells in red with immunostaining for insulin and hand2:EGFP+ mesenchyme in green. White arrowheads point to β-cells in the pancreas (F, I). Dashed rectangles indicate the ectopic β-cells intermingling with the mesenchyme between the pronephros and the pancreas, without co-expressing insulin and hand2:EGFP (J, K). Selected area in dashed ovals shows other ectopic β-cells intermingling with the mesenchyme ventral to the pancreas (I, K). Scale bars = 20 μm. Anatomical axes: D (dorsal), V (ventral), A (anterior), and P (posterior).
|
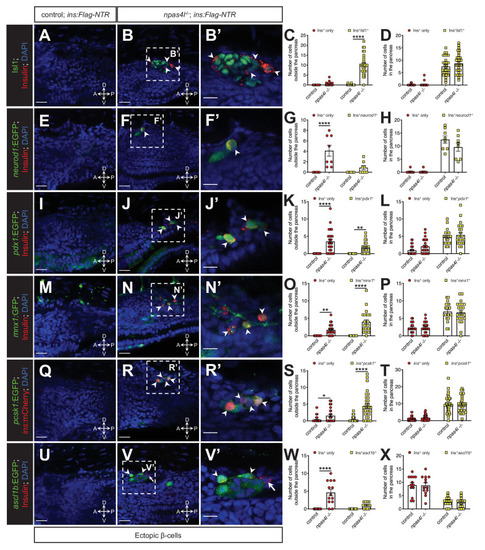
Representative confocal images of the tissues adjacent to the pancreas of control siblings and npas4l−/− Tg(ins:Flag-NTR) zebrafish larvae at 3 dpf after β-cell ablation by MTZ at 1–2 dpf, displaying cells expressing pancreatic endocrine cell markers Isl1 (A–B’), neurod1 (E–F’), pdx1 (I–J’), mnx1 (M–N’), pcsk1 (Q–R’), and ascl1b (U–V’) in green, and ectopic β-cells in red with immunostaining for insulin (except Q–R’ with the mCherry fluorescence driven by the insulin promoter). Arrowheads point to ectopic β-cells that express corresponding markers. Arrows point to β-cells that do not express ascl1b (V and V’). B’, F’, J’, N’, R’, and V’ are magnified from the areas indicated by the white dashed square in B, F, J, N, R, and V, respectively. Quantification of β-cells with or without corresponding marker expression in the ectopic location (C, G, K, O, S, and W) or in the pancreas (D, H, L, P, T, and X) per larva at 3 dpf. *p=0.0310, **p=0.0039, and ****p<0.0001 (Šidák’s multiple comparisons test); (C, D) n = 30 (control) and 31 (npas4l−/−); (G, H) n = 8 (control) and 8 (npas4l−/−); (K, L) n = 25 (control) and 24 (npas4l−/−); (O, P) n = 21 (control) and 23 (npas4l−/−); (S, T) n = 40 (control) and 32 (npas4l−/−); (W and X) n = 13 (control) and 13 (npas4l−/−). Data are represented as the mean ± SEM. Scale bars = 20 μm except B’, F’, J’, N’, R’, and V’ (10 μm). Anatomical axes: D (dorsal), V (ventral), A (anterior), and P (posterior).
|
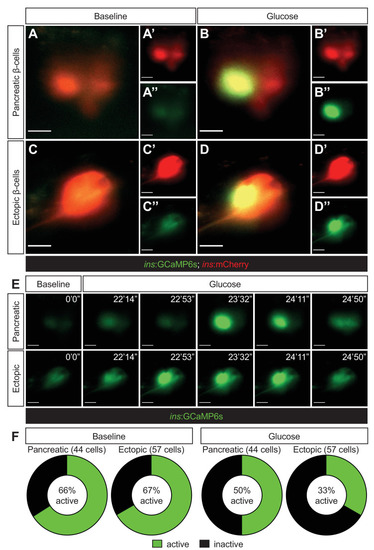
Representative images captured from a live calcium imaging video of npas4l−/−Tg(ins:GCaMP6s);Tg(ins:mCherry);Tg(ins:Flag-NTR) zebrafish larvae at 3 dpf after β-cell ablation by MTZ from 1 to 2 dpf, showing β-cells expressing ins:mCherry in red and displaying calcium activity in green in the pancreatic (A, B) or ectopic (C, D) domain at the baseline (A, C) or after the addition of 200 mM of glucose to the E3 medium (B, D). (E) Sequential images captured from a live calcium imaging video to show the oscillation of calcium signalling at the baseline and after the glucose treatment, displaying the GCaMP6s signal in green. (F) Quantification of pancreatic or ectopic β-cells displaying calcium activity at the baseline or after glucose treatment in 11 (pancreatic) or 17 (ectopic) npas4l zebrafish mutants. Scale bars = 10 μm.
|
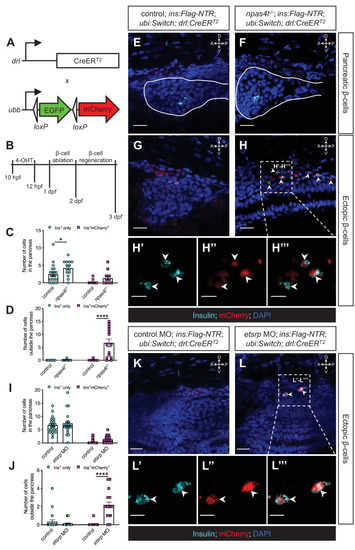
(A) Constructs of −6.35drl:Cre-ERT2 (drl:CreERT2) and −3.5ubb:LOXP-EGFP-LOXP-mCherry (ubi:Switch). Upon 4-OHT induction between 10 and 12 hpf, Cre recombinase expressed by the drl promoter cleave the loxP sites to allow ubb:mCherry expression in the cells that once expressed drl. (B) Scheme for tracing the mesodermal lineage of ectopic β-cells in control siblings and npas4l−/− Tg(ins:Flag-NTR);Tg(ubi:Switch);Tg(drl:CreERT2) zebrafish larvae. (C, D, I, and J) Quantification of the pancreatic or ectopic β-cells with or without mesodermal lineage in npas4l mutants (C, D) or etsrp morpholino (MO)-injected larvae (I, J) at 3 dpf. *p=0.0227 and ****p<0.0001 (Šidák’s multiple comparisons test); (C, D) n = 21 (control) and 14 (npas4l−/−) or (I, J) n = 21 (control) and 23 (etsrp MO). Data are represented as the mean ± SEM. Standard control MO (4 ng) and etsrp MO2 (4 ng) were injected to the control group and etsrp MO group respectively at the one-cell stage (I, J, K–L’’’). (E–H’’’ and K–L’’’) Representative confocal images of pancreatic (E, F) or ectopic β-cells (G, H) of control siblings and npas4l−/−, or ectopic β-cells in control or etsrp MO-injected (K, L) Tg(ins:Flag-NTR);Tg(ubi:Switch);Tg(drl:CreERT2) zebrafish larvae at 3 dpf after β-cell ablation by MTZ at 1–2 dpf, displaying β-cells in cyan with immunostaining for insulin and lineage-traced cells derived from drl-expressing mesodermal cells in red from the Cre-recombined ubi:Switch. Pancreata are outlined by solid white lines (E, F). Arrowheads point to ectopic β-cells derived from the mesoderm (H–H’’’ and L–L’’’). Selected areas in dashed squares in (H) and (L) are magnified in split (H’, H’’, L’ and L’’) and merged (H’’’ and L’’’) channels, respectively. Scale bars = 20 μm (E–H, K, and L) or 10 μm (H’–H’’’ and L’–L’’). Anatomical axes: D (dorsal), V (ventral), A (anterior), and P (posterior).
|
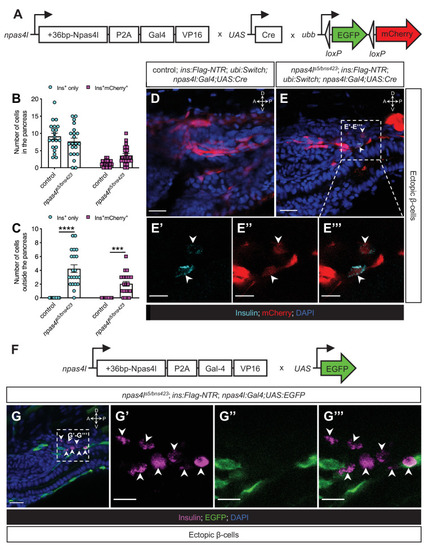
(A) Schematics of npas4lPt(+36-npas4l-p2a-Gal4-VP16)bns423 (npas4l:Gal4), UAS:Cre and −3.5ubb:LOXP-EGFP-LOXP-mCherry (ubi:Switch). (B, C) Quantification of the pancreatic or ectopic β-cells with or without npas4l-positive mesodermal origin in control or transheterozygous npas4ls5/bns423 mutants at 3 dpf. ***p=0.0001 and ****P<0.0001 (Šidák’s multiple comparisons test); n = 20 (control) and 21 (npas4ls5/bns423). Data are represented as the mean ± SEM. (D–E’’’) Representative confocal images of ectopic β-cells and npas4l-positive lineage-traced cells in control siblings and npas4ls5/bns423 Tg(ins:Flag-NTR);Tg(ubi:Switch);Tg(npas4l:Gal4);Tg(UAS:Cre) zebrafish larvae at 3 dpf after β-cell ablation by MTZ from 1 to 2 dpf, displaying β-cells in cyan with immunostaining for insulin and lineage-traced cells derived from npas4l-expressing mesodermal cells in red from the Cre-recombined ubi:Switch. The selected area in a dashed square in (E) is magnified in split (E’ and E’’) and merged (E’’’) channels, respectively. Arrowheads point to ectopic β-cells derived from the mesoderm (E–E’’’). (F) Schematics of npas4lPt(+36-npas4l-p2a-Gal4-VP16)bns423 (npas4l:Gal4) and UAS:EGFP. (G–G’’’) Representative confocal images of ectopic β-cells losing npas4l expression in npas4ls5/bns423 Tg(ins:Flag-NTR); Tg(npas4l:Gal4);Tg(UAS:EGFP) zebrafish larvae at 3 dpf after β-cell ablation by MTZ from 1 to 2 dpf, displaying β-cells in magenta with immunostaining for insulin and cells expressing npas4l in green. The selected area in a dashed square in (G) is magnified in split (G’ and G’’) and merged (G’’’) channels, respectively. Arrowheads point to ectopic β-cells without npas4l expression (G–G’’’). Scale bars = 20 μm (D, E, and G) or 10 μm (E’–E’’’ and G’–G’’). Anatomical axes: D (dorsal), V (ventral), A (anterior), and P (posterior).
|
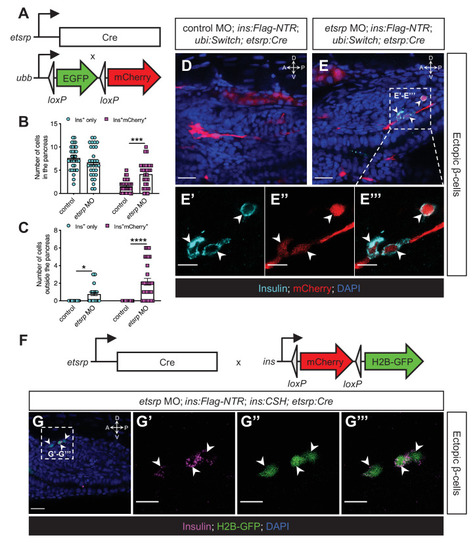
(A) Constructs of etsrp:Cre and −3.5ubb:LOXP-EGFP-LOXP-mCherry (ubi:Switch). (B, C) Quantification of the pancreatic or ectopic β-cells with or without etsrp-positive mesodermal origin in control or etsrp morpholino (MO)-injected larvae at 3 dpf. *p=0.0169, ***p=0.0002, and ****p<0.0001 (Šidák’s multiple comparisons test); n=33 (control) and 30 (etsrp MO). Data are represented as the mean ± SEM. (D–E’’’) Representative confocal images of ectopic β-cells and etsrp-positive lineage-traced cells in control or etsrp MO-injected Tg(ins:Flag-NTR);Tg(ubi:Switch);Tg(etsrp:Cre) zebrafish larvae at 3 dpf after β-cell ablation by MTZ at 1–2 dpf, displaying β-cells in cyan with immunostaining for insulin and lineage-traced cells derived from etsrp-expressing mesodermal cells in red from the Cre-recombined ubi:Switch. The selected area in a dashed square in (E) is magnified in split (E’, E’’) and merged (E’’’) channels, respectively. Arrowheads point to ectopic β-cells derived from the mesoderm (E–E’’’). (F) Constructs of etsrp:Cre and ins:LOXP-mCherry-LOXP-Hsa.HIST1H2BJ-GFP (ins:CSH). (G–G’’’) Representative confocal images of ectopic β-cells derived from the etsrp-expressing lineage in etsrp MO-injected Tg(ins:Flag-NTR);Tg(ins:CSH);Tg(etsrp:Cre) zebrafish larvae at 3 dpf after β-cell ablation by MTZ at 1–2 dpf, displaying β-cells in magenta with immunostaining for insulin and lineage-traced cells derived from etsrp-expressing mesodermal cells in nuclear green from the Cre-recombined ins:CSH. The selected area in a dashed square in (G) is magnified in split (G’ and G’’) and merged (G’’’) channels, respectively. Scale bars = 20 μm (D, E, and G) or 10 μm (E’–E’’’ and G’–G’’’). Anatomical axes: D (dorsal), V (ventral), A (anterior), and P (posterior).
|
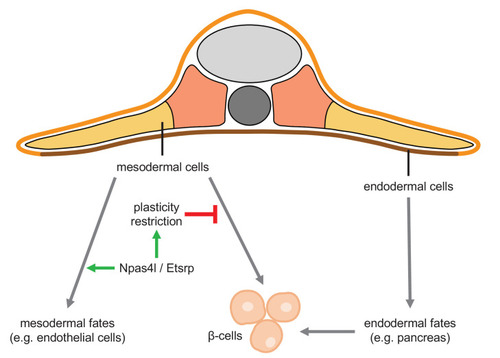
Mesoderm and endoderm normally follow Waddington’s landscape model to further differentiate into cells with mesodermal fates and endodermal fates, respectively, during development. However, mutating npas4l or knocking down etsrp not only abolishes the endothelial/myeloid specification but also induces plasticity of mesodermal cells to enable their differentiation into β-cells across the germ layer boundary.
|