FIGURE SUMMARY
Title

Identification and functional modelling of plausibly causative cis-regulatory variants in a highly-selected cohort with X-linked intellectual disability

Authors
Bengani, H., Grozeva, D., Moyon, L., Bhatia, S., Louros, S.R., Hope, J., Jackson, A., Prendergast, J.G., Owen, L.J., Naville, M., Rainger, J., Grimes, G., Halachev, M., Murphy, L.C., Spasic-Boskovic, O., van Heyningen, V., Kind, P., Abbott, C.M., Osterweil, E., Raymond, F.L., Roest Crollius, H., FitzPatrick, D.R.
Source
Full text @ PLoS One

Project summary and XLID-associated regulatory variants and their predicted target genes.

(A) A diagrammatic summary of the experimental pipeline followed in this paper. (B) Schematic showing the genomic region of the six genomic variants in the five probands (S19, S24, S43, S3 and S31) indicating the location of the XLID-associated CRE variants along with their predicted target genes indicated in red, genomic coordinates from h19/GRCh37 genome build. The variants highlighted by grey box were used to make mouse models.

<italic toggle='yes'>TENM1</italic><sup>CRE</sup> alters enhancer function in the zebrafish brain by creating a repressive SIX3 binding site.

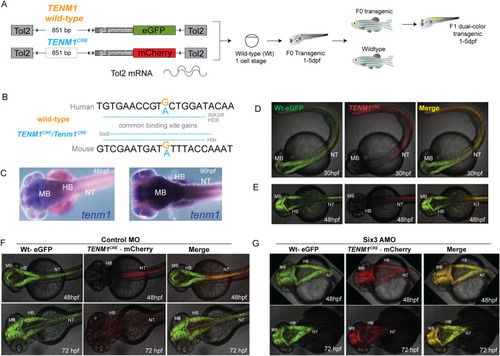
(A) A diagrammatic summary of the dual color fluorescence assay used in this study. The size of the human TENM1 element is provided in the left hand panel in base pairs (bp) (B) Human and mouse (TENM1CRE/Tenm1CRE) sequences are shown with the variant base marked in blue, resulting in gain of SIX3/SIX6 and HDX binding sites in TENM1CRE and Six6 and Hdx binding sites in Tenm1CRE. (C) mRNA in situ hybridization showing expression of tenm1 in midbrain, hindbrain and neural tube during embryonic development in wild-type zebrafish. (D-E) Dual color fluorescent transgenic assay in zebrafish with wild-type (Wt) and mutant TENM1CRE driving eGFP and mCherry expression respectively. Loss of enhancer activity is observed in midbrain and hindbrain with the mutant TENM1CRE allele. Further examples of embryos for different stable lines are shown in S34 Fig in S1 File. (F-E) six3 knockdown rescues the effect of the mutant variant on the activity of TENM1CRE. Control morpholino injected embryos show loss of reporter activity in midbrain and hindbrain by mutant allele, where the mutation creates a Six3 binding site (E). Knockdown of Six3 rescues the activity of mutant allele in the midbrain and hindbrain (F). MB: Midbrain; HB: Hindbrain; NT: Neural tube; hpf: Hours post fertilization.

<italic toggle='yes'>FMR1</italic><sup xmlns:xlink='http://www.w3.org/1999/xlink'>CRE</sup> alters enhancer function in the zebrafish brain.

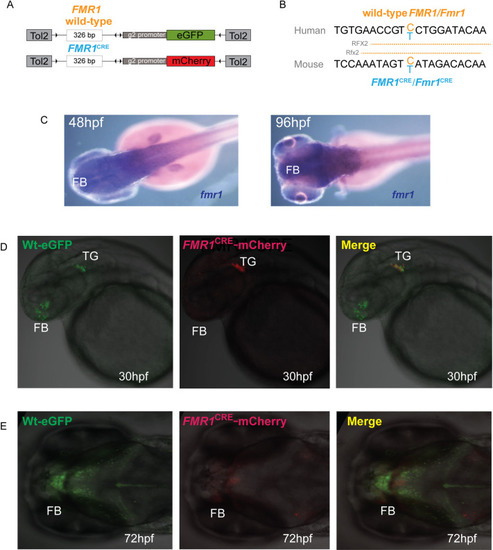
(A) A diagrammatic summary of the dual color fluorescence assay plasmid constructs used in this study. The size of the human FMR1 element is provided in base pairs (bp) (B) Human and mouse (FMR1CRE/Fmr1CRE) sequences are shown with the variant base marked in blue, resulting in predicted loss of a RFX2/Rfx2 binding site in FMR1CRE/Fmr1CRE. (C) mRNA in situ hybridization showing expression of fmr1 in forebrain and midbrain during embryonic development in wild-type zebrafish. (D-E) Dual color fluorescent transgenic assay in zebrafish with wild-type (Wt) and mutant FMR1CRE driving eGFP and mCherry expression respectively. Loss of enhancer activity is observed in forebrain with the mutant FMR1CRE allele. Further examples of embryos for different stable lines are shown in S35 Fig in S1 File. FB: Forebrain; MB: Midbrain; TG: Trigeminal ganglia; NP: hpf: Hours post fertilization.

EXPRESSION / LABELING:
Genes:
Fish:
Anatomical Terms:
Stage Range: Prim-15 to Day 4
PHENOTYPE:
Fish:
Observed In:
Stage Range: Prim-15 to Protruding-mouth

Expression levels of <italic toggle='yes'>Fmr1</italic> and FMRP in <italic toggle='yes'>Fmr1</italic><sup>CRE</sup>.

Frontal (A) and saggital (B) views of 13.5GD embryonic mouse heads following whole-mount in situ hybridization for Fmr1. In each panel the wild-type male embryo is shown on the left and the Fmr1CRE embryo on the right. There is loss of expression of Fmr1 in the nasal placode and midbrain Fmr1CRE mutant embryos as compared to wild-type embryos. The Fmr1CRE embryos had been deliberately over-developed in the chromogenic substrate compared to the wild-type embryos to emphasize the signal difference. Saggital H&E stained section of whole brain (C) with detailed view (white dashed box) of the hippocampus (D) with marked hippocampus regions indicating the regions analysed in (F) numbered 1–8, starting from dentate gyrus. (E) Reference image of RNAscope processed section with Fmr1 transcript (red), Pax6 transcript (green) and nucleus (blue/DAPI). Each transcript is represented by a spot following the quantitative image processing. (F) Graphical representation of Fmr1 transcripts normalised to Pax6 transcripts (used as control) between Fmr1CRE (purple) compared to wild-type littermates (orange) and data represent average of four replicates (n = 4) ±SE. Levels of significance were determined by 2-tailed Student’s t-test, with p values lower than 0.05 considered statistically significant. No significant difference was observed in the Fmr1 transcript levels. (G) Western blot of hippocampal tissue from four Fmr1CRE, four wild-type and two Fmr1-null mice at P25 using an antibody that detects FMRP. (H) Quantitation of the FMRP bands in (G) indicating an apparent increase in FMRP in Fmr1CRE hippocampal slices. All quantitative data are presented as mean ±SE and p value of 0.05 or less is considered statistically significant. (* means difference is statistically significant). FB: Forebrain; MB: Midbrain; NP: Nasal placode; DG: Dentate gyrus.

Olfaction testing of <italic toggle='yes'>Fmr1</italic><sup>CRE</sup> and <italic toggle='yes'>Tenm1</italic><sup>CRE</sup> mouse lines.

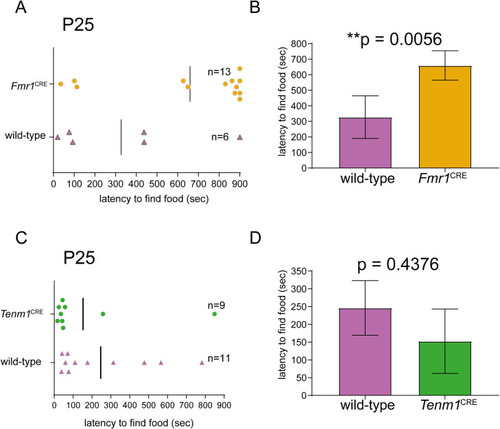
(A, B) The mice hemizygous for the variant in Fmr1CRE showed a significant increase in time to discovery compared to wild-type male controls in a buried food test. (C, D) No significant difference in the levels of latency to find food was observed in mice hemizygous for the variant in Tenm1CRE compared to wild-type littermates. The numbers of animals tested (n) are given in (A) and (C). All quantitative data are presented as mean ±SE and p value of 0.05 or less is considered statistically significant. (* means difference is statistically significant).

Functional analysis of <italic toggle='yes'>FMR1</italic><sup>CRE</sup> mice.

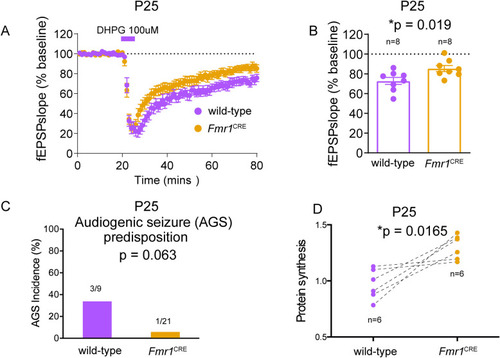
(A) Comparison of mGluR-dependent long-term depression (LTD) in CA3-CA1 components of the hippocampus of eight Fmr1CRE male mice and eight wild-type male littermates indicates a significant Fmr1CRE-associated decrease in LTD. (B) All quantitative data are presented as mean ±SE and p value of 0.05 or less is considered statistically significant.(C) No significant difference was observed in audiogenic seizure incidence in the hemizygous mice with the variant Fmr1CRE(1/21) compared to wild-type littermates(3/9). Statistical significance is determined using two-tailed Fisher’s exact test and p value of 0.05 or less is considered statistically significant.(D) Significant increase in bulk protein synthesis levels in slices from dorsal hippocampus of Fmr1CRE knock-in mutant male mice as compared to wild-type male littermates. Quantitative data is derived from number of biological replicates used (n = 6) in the experiments. Levels of significance were determined by 2-tailed Student’s t-test, with p values lower than 0.05 considered statistically significant. (* means difference is statistically significant).

Family 347 pedigree.

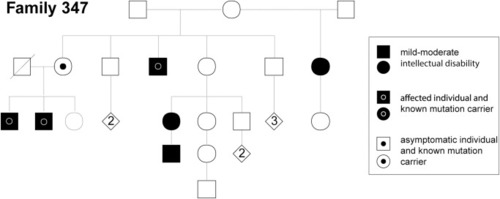
Pedigree of Family 347 of which individual S3 is a member showing segregation of the mutation affecting FMR1 expression.

Acknowledgments
This image is the copyrighted work of the attributed author or publisher, and ZFIN has permission only to display this image to its users. Additional permissions should be obtained from the applicable author or publisher of the image. Full text @ PLoS One