
- Title
-
Antimelanogenesis Effects of Leaf Extract and Phytochemicals from Ceylon Olive (Elaeocarpus serratus) in Zebrafish Model
- Authors
- Huang, C.Y., Liu, I.H., Huang, X.Z., Chen, H.J., Chang, S.T., Chang, M.L., Ho, Y.T., Chang, H.T.
- Source
- Full text @ Pharmaceutics
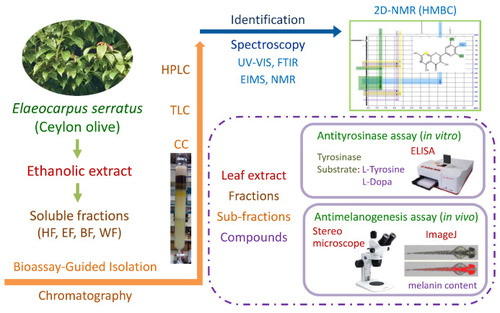
Figure 1. Schematic diagram of antimelanogenesis effects of E. serratus leaf extract.
|

Figure 2. Antityrosinase activities of leaf extract and fractions. (a) l-Tyrosine as the substrate; (b) l-DOPA as the substrate.
|

Figure 3. Chemical structures of isolated compounds. |
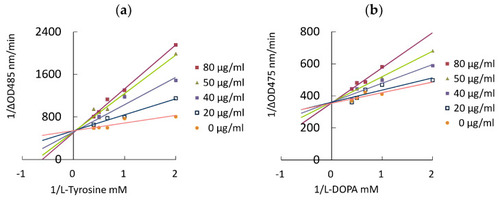
Figure 4. Lineweaver–Burk plots of mearnsetin. (a) l-Tyrosine as the substrate; (b) l-DOPA as the substrate.
|

Figure 5. Inhibitory effect of leaf extract and its fractions on the melanogenesis of zebrafish embryo. Different letters (a–e) represent significantly different at the level of p < 0.05 according to Scheffe’s test.
|
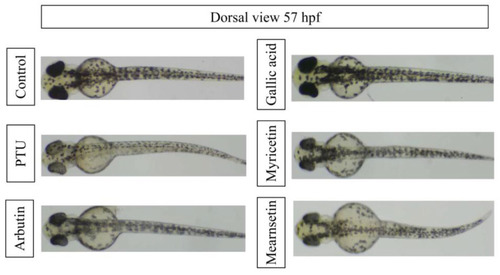
Figure 6. Effects of compounds on melanogenesis of zebrafish at a concentration of 50 μM.
|