
- Title
-
The E3 ubiquitin-protein ligase Rbx1 regulates cardiac wall morphogenesis in zebrafish
- Authors
- Sarvari, P., Rasouli, S.J., Allanki, S., Stone, O.A., Sokol, A., Graumann, J., Stainier, D.Y.R.
- Source
- Full text @ Dev. Biol.
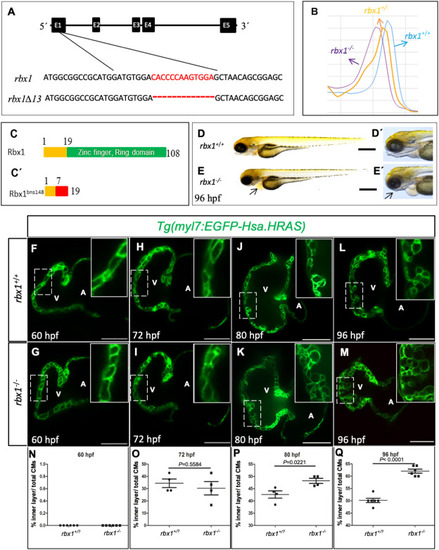
rbx1 mutant hearts exhibit a multi-layered myocardial wall phenotype (A) TALENs targeting the first exon (E1) of rbx1; the bns148 allele has a 13 bp deletion. (B) Genotyping of rbx1+/+, rbx1+/− and rbx1−/− using high resolution melt analysis. (C) Structure of WT Rbx1. (C′) Structure of the predicted mutant Rbx1, which contains 7 amino acids followed by 12 missense codons (red). (D, E′) Lateral views of 96 hpf rbx1+/+ and rbx1−/− larvae; mutants exhibit pericardial edema (arrow, E) as well as jaw formation defects (arrowhead, E′). (F–M) Confocal images (mid-sagittal sections) of Tg(myl7:EGFP-Hsa.HRAS) hearts from rbx1 animals at 60 (F–G), 72 (H–I), 80 (J–K) and 96 (L–M) hpf. Magnified views of dashed areas shown in top right corners. (N–Q) Percentage of inner layer CMs relative to the total number of CMs. At 60 (N) and 72 (O) hpf, no significant difference is observed between rbx1+/? and rbx1−/− animals. However, at 80 (P) and 96 (Q) hpf, rbx1−/− larvae exhibit a higher percentage of inner layer CMs. Each dot represents one heart. Data are shown as mean ± SEM. P-values calculated by Student's t-test. V: ventricle, A: atrium; scale bars, 500 μm (D–E), 50 μm (F–M). |

Cardiomyocyte proliferation is reduced in rbx1 mutants (A-F) 3D Confocal images (maximum intensity projections) of Tg(myl7:mVenus-gmnn); Tg(myl7:mCherry-ctd1) hearts at 48 (A–B), 74 (C–D) and 106 (E–F) hpf. (G–I) Quantification of proliferative ventricular CMs from 48 until 106 hpf. At 106 hpf, the number of proliferative CMs in rbx1+/? larvae is significantly higher than that in rbx1−/− siblings (I). (G′-I′) Percentage of proliferative ventricular CMs from 48 until 106 hpf. At 106 hpf, a significantly higher percentage of proliferative CMs is observed in rbx1+/? larvae compared with rbx1−/− siblings (I′). Each dot represents one heart. Data are shown as mean ± SEM. P-values calculated by Student's t-test. V: ventricle, A: atrium; scale bars, 50 μm. |
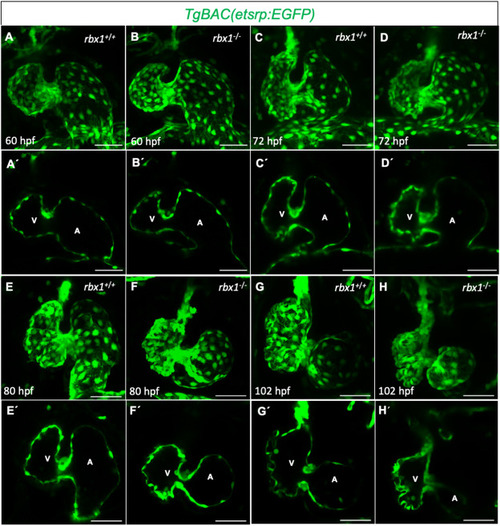
The endocardium is affected in rbx1 mutants (A-H′) 3D Confocal images (maximum intensity projections) (A–H), and 2D mid-sagittal sections (A′-H′) of the endocardium from rbx1 animals. (A-F′) Endocardial morphology in rbx1+/+ and rbx1−/− siblings at 60 (A-B′), 72 (C-D′) and 80 (E-F′) hpf. At 72 hpf a minor reduction in ventricular size is visible in rbx1 mutants (C-D′). At 80 hpf, rbx1 mutants exhibit a smaller ventricle with a stretched AV canal and outflow tract (E-F′). (G-H′) Endocardial morphology in rbx1+/+ (G-G′) and rbx1−/− (H–H′) siblings at 102 hpf. rbx1−/− larvae exhibit a smaller ventricle (H–H′) compared with rbx1+/+ (G-G′) siblings. PHENOTYPE:
|
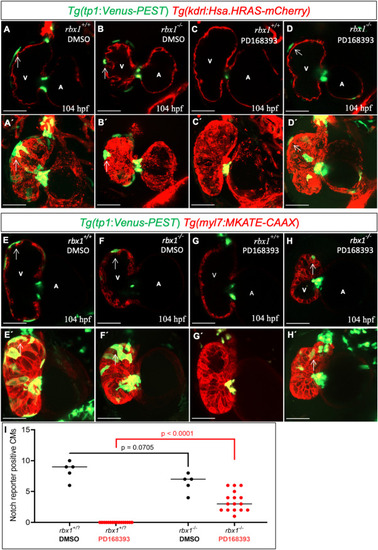
Notch signaling reporter expression is observed in cardiomyocytes in the absence of ErbB2 signaling in rbx1 mutants (A-D′) Confocal images of 104 hpf Tg(tp1:VenusPEST); Tg(kdrl:Hsa.HRAS-mCherry) hearts in 2D mid-sagittal views (A–D), and 3D maximum intensity projections (A′-D′). (A-B′) Notch reporter expression after DMSO treatment in rbx1+/+ (A-A′) and rbx1−/− (B–B′) larvae indicated with arrows. (C-D′) Notch reporter expression after ErbB2 inhibitor treatment in rbx1+/+ (C–C′) and rbx1−/− (D-D′, arrows) larvae. rbx1+/+ larvae do not exhibit Notch reporter expression in their ventricular myocardium in the absence of ErbB2 signaling (C–C′), while Notch reporter expression is observed in the ventricular myocardium in rbx1−/− (D-D′, arrows) larvae even in the absence of ErbB2 signaling. (E-H′) Confocal images of 104 hpf Tg(tp1:VenusPEST); Tg(myl7:MKATE-CAAX) hearts in 2D sagittal views (E–H) and 3D maximum intensity projections (E′-H′). (E-F′) Notch reporter expression after DMSO treatment in rbx1+/+ (E-E′) and rbx1−/− (F–F′) larvae is indicated with white arrows. (G-H′) Notch reporter expression in the absence of ErbB2 signaling is only observed in the ventricular myocardium in rbx1−/− larvae (H–H′ arrow). (I) Quantification of Notch positive CMs in 104 hpf rbx1+/+ and rbx1−/− ventricles treated with DMSO or ErbB2 inhibitor. Each dot represents one heart. Data are shown as mean ± SEM. P-values calculated by Student's t-test. V: ventricle, A: atrium; scale bars, 50 μm. |
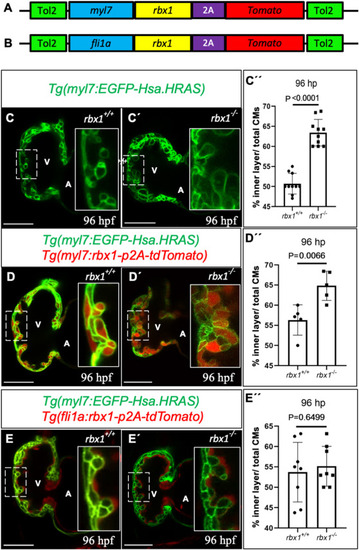
rbx1 overexpression in endothelial cells can rescue the multi-layered myocardial wall phenotype in rbx1 mutants (A-B) Cartoon of rbx1 overexpression transgene constructs under myocardial-specific (A) or endothelial-specific (B) promoters. (C–C′) Confocal images (mid-sagittal sections) of 96 hpf Tg(myl7:EGFP-Hsa.HRAS) rbx1+/+ (C) and rbx1−/− (C′) hearts. (D-E′) Overexpression of rbx1 in the endothelium but not the myocardium can rescue the myocardial wall phenotype in rbx1−/− larvae. (D-D′) Confocal images (mid-sagittal sections) of 96 hpf rbx1+/+ (D) and rbx1−/− (D′) hearts in the presence of the myl7:rbx1-p2a-tdTomato transgene. (E-E′) Confocal images (mid-sagittal sections) of 96 hpf rbx1+/+ (E) and rbx1−/− (E′) hearts in the presence of the fli1a:rbx1-p2a-tdTomato transgene. Magnified views of dashed areas shown in the right corners. (C"-E") Percentage of inner layer CMs relative to the total number of CMs comparing rbx1+/+ and rbx1−/− hearts having no rbx1 overexpression (C'’), and with overexpression of rbx1 in the myocardium (D'’) or endocardium (E'’). V: ventricle, A: atrium; scale bars, 50 μm. |
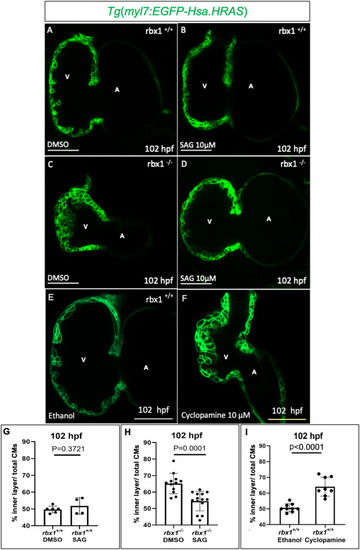
Pharmacological activation of Hedgehog signaling normalizes the multi-layered myocardial wall phenotype in rbx1 mutants (A-D) Confocal images (mid-sagittal sections) of 102 hpf hearts from Tg(myl7:EGFP-Hsa.HRAS) rbx1+/− incrosses. Sagittal views of the ventricle from rbx1+/+ (A–B) or rbx1−/− (C–D) siblings treated with DMSO (A, C) or 10 μM of the hedgehog activator drug (SAG) (B, D) from 48 to 96 hpf. (E–F) Confocal images (mid-sagittal sections) of 102 hpf hearts from Tg(myl7:EGFP-Hsa.HRAS) rbx1+/+ animals treated with ethanol (E) or 10 μM of the hedgehog inhibitor drug (Cyclopamine) from 48 to 96 hpf (F). (G–H) Percentage of inner layer CMs relative to the total number of CMs after DMSO or SAG treatment in rbx1+/+ (G) and rbx1−/− (H) larvae. (I) Percentage of inner layer CMs relative to the total number of CMs after ethanol or Cyclopamine treatment in rbx1+/+ animals. Each dot represents one heart. Data are shown as mean ± SEM. P-values calculated by Student's t-test. V: ventricle, A: atrium; scale bars, 50 μm. |
Reprinted from Developmental Biology, 480, Sarvari, P., Rasouli, S.J., Allanki, S., Stone, O.A., Sokol, A., Graumann, J., Stainier, D.Y.R., The E3 ubiquitin-protein ligase Rbx1 regulates cardiac wall morphogenesis in zebrafish, 1-12, Copyright (2021) with permission from Elsevier. Full text @ Dev. Biol.