
- Title
-
The blood flow-klf6a-tagln2 axis drives vessel pruning in zebrafish by regulating endothelial cell rearrangement and actin cytoskeleton dynamics
- Authors
- Wen, L., Zhang, T., Wang, J., Jin, X., Rouf, M.A., Luo, D., Zhu, Y., Lei, D., Gregersen, H., Wang, Y., Wang, G.
- Source
- Full text @ PLoS Genet.
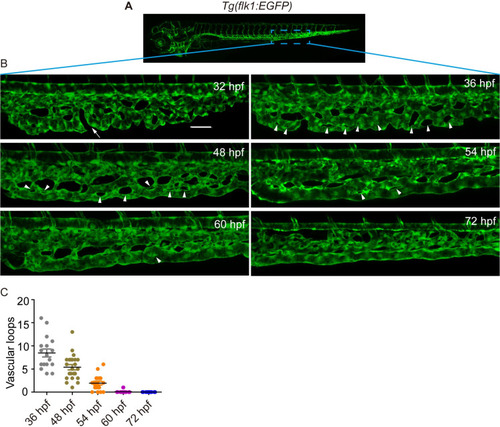
(A) A sketch map of the region. (B) Confocal images of the caudal vasculature of zebrafish embryos. The arrow points to ventral CVP capillaries without connection. Arrowheads point to vascular loops. Scale bar: 50 μm. (C) Quantification of the number of vascular loops in the CV: 36 hpf, n = 17 embryos; 48 hpf, n = 23 embryos; 54 hpf, n = 19 embryos; 60 hpf, n = 22 embryos; 72 hpf, n = 13 embryos. EXPRESSION / LABELING:
|
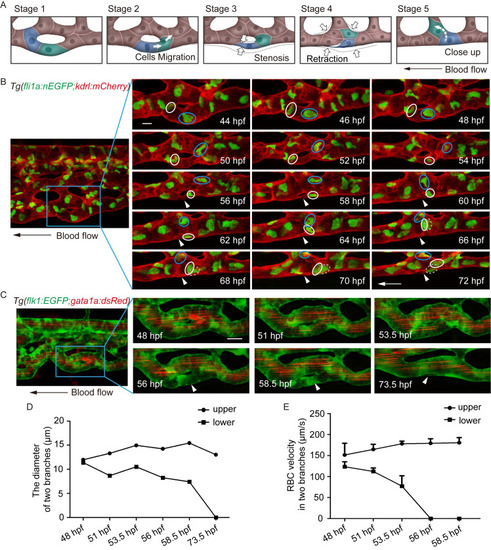
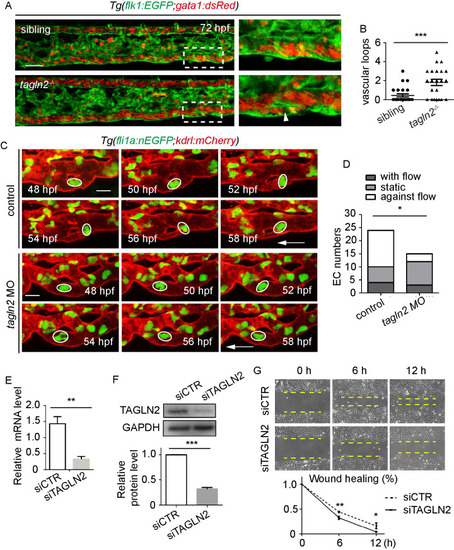
(A) Sketch map of EC rearrangement during vessel pruning. (B) Time-lapse live imaging of Tg(fli1a:nEGFP;kdrl:mCherry) embryos shows EC nucleus migration in CV pruning. Arrowheads indicate the pruned vessel. The arrows indicate the direction of the blood flow. Colored circles indicate ECs nuclei. 24 time-lapse live imaging were taken. Scale bar: 10 μm. (C) Time-lapse live imaging of Tg(flk1:EGFP;gata1a:dsRed) embryos shows vessel stenosis and the change of blood flow in CV pruning. Arrowheads indicate the lack of blood flow in the regressing vessel. The arrow indicates the direction of the blood flow. 10 time-lapse live imaging were taken. Scale bar: 10 μm. (D) The diameters of two branches at the indicated stages. (E) The velocity of RBCs in two branches at the indicated stages (48 hpf: S1 Video, 51 hpf: S2 Video, 53.5 hpf: S3 Video, 56 hpf: S4 Video, 58.5 hpf: S5 Video). The number of RBCs is calculated for blood flow at each stage: upper branch, 48.5 hpf: n = 5, 51 hpf: n = 10, 53.5 hpf: n = 8, 56 hpf: n = 9, 58.5 hpf: n = 10; lower branch, 48.5 hpf: n = 10, 51 hpf: n = 9, 53.5 hpf: n = 2. EXPRESSION / LABELING:
|
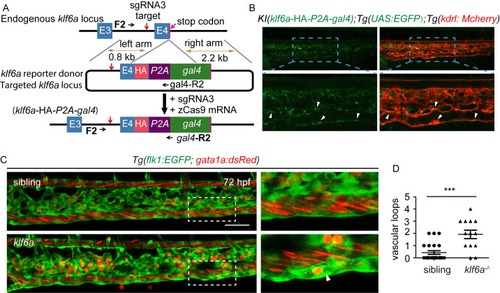
(A) Generation of EXPRESSION / LABELING:
PHENOTYPE:
|
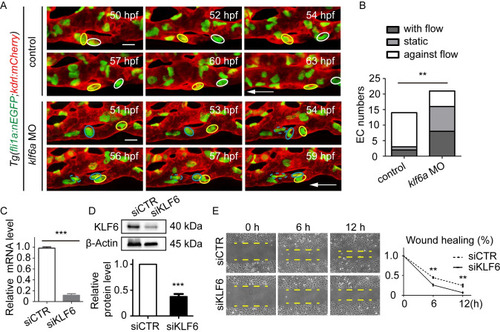
(A) Time-lapse live imaging of |
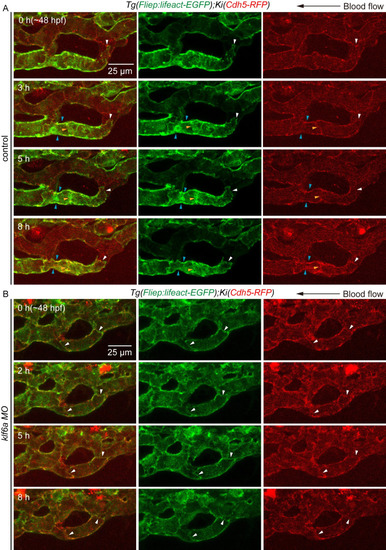
(A) and (B) Time-lapse live imaging of junction remodeling and actin cytoskeleton dynamics in CV pruning in |
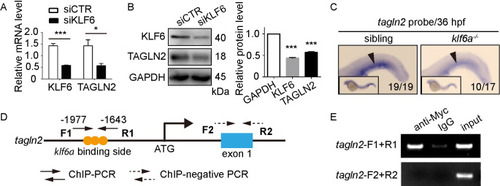
(A) and (B) SiKLF6 in HUVECs efficiently decrease TAGLN2 expression at the mRNA (KLF6: |
(A) Role of EXPRESSION / LABELING:
PHENOTYPE:
|
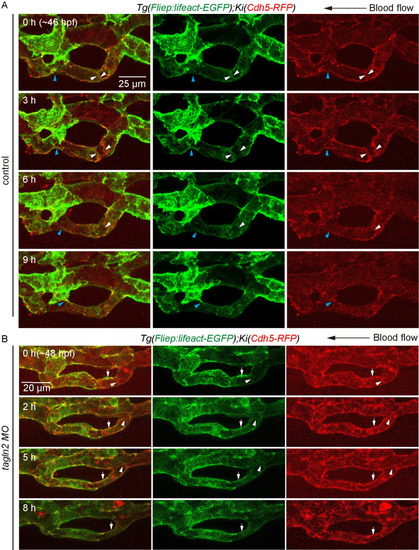
(A) and (B) Time-lapse live imaging of junction remodeling and actin cytoskeleton dynamics in CV prunig in |